Figures & data
Figure 1 ECG, ST waves elevation in anterolateral leads, pathologic Q waves in lateral leads, ventricular ectopic beats.
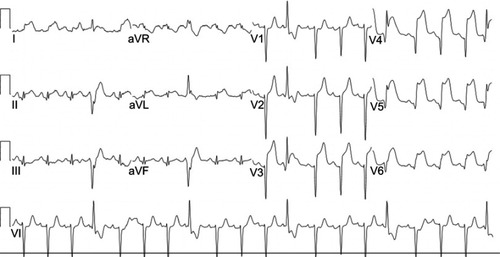
Figure 2 (A) RAO 20-caudal 20 view left coronary angiography: proximal LAD thrombus and thrombolysis in myocardial infarction (TIMI) flow grade 0. (B) RAO 10-cranial 40 view: a 4.0×22 mm drug-eluting stent was placed in the proximal LAD to restore normal TIMI flow grade 3. Right coronary angiography (not shown) was normal.
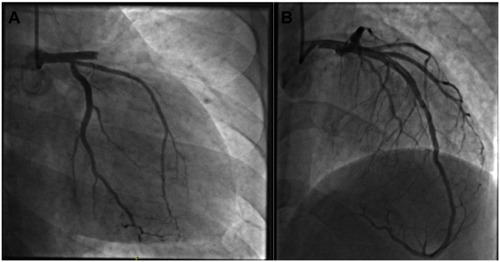
Figure 3 ECG, sinus tachycardia with ST waves elevation and pathologic Q waves in the anterolateral leads.
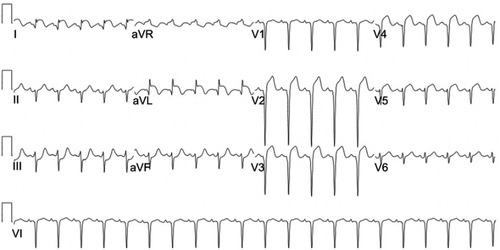
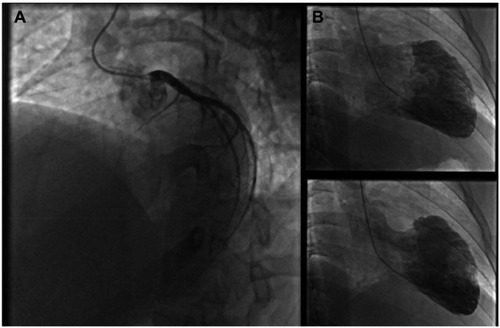
Figure 4 (A) LAO 45-cranial 25 view left coronary angiography: complete proximal LAD occlusion. (B) Left ventriculography revealing severe left ventricular systolic dysfunction and antero-apical akinesia. Right coronary angiography (not shown) was normal.