
Figures & data
Table 1 Patient Demographic Data
Figure 1 A 39-year-old HIV-infected female presented with bilateral optic neuritis and cryptococcal meningitis. (A) axial contrast-enhanced T1-weighted images with fat suppression showed enhancement of both optic nerves at the intraorbital, intracanal, and intracranial segments (arrows); (B) coronal contrast-enhanced T1-weighted images with fat suppression showed enhancement of both optic nerves at the intraorbital segments (arrows); (C) coronal contrast-enhanced T1-weighted images with fat suppression showed enhancement of both optic nerves at the intracranial segments (arrows); (D) Axial T2-weighted images with fat suppression showed signal hyperintensity at both cerebral peduncles (arrows) and intraorbital optic nerves; (E) Coronal T2-weighted images with fat suppression showed intracranial optic nerve signal hyperintensity (arrows); (F) axial fluid-attenuation inversion recovery images of the brain showed signal hyperintensity at the genu and posterior limb of left internal capsule (arrowheads); (G) axial contrast-enhanced T1-weighted images of the brain showed abnormal enhancement at the genu and posterior limb of left internal capsule (arrowheads); (H) axial contrast-enhanced T1-weighted images of the brain showed mild leptomeningeal enhancement, suggestive of meningitis.
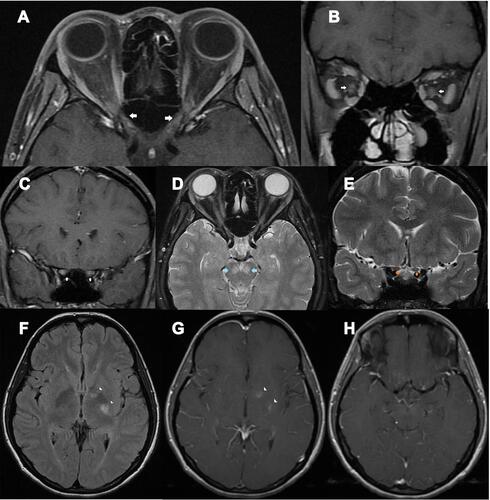
Figure 2 A 49-year-old HIV-infected female, who received antiretroviral therapy with well-controlled HIV viral load, presented with bilateral optic neuritis (immune reconstitution inflammatory syndrome-associated optic neuritis). (A) axial contrast-enhanced T1-weighted images with fat suppression showed enhancement of both optic nerves at the intracanal and intracranial segments (arrows); (B) coronal contrast-enhanced T1-weighted images with fat suppression showed enhancement of both optic nerves at the intraorbital segments (arrows); (C) coronal contrast-enhanced T1-weighted images with fat suppression showed enhancement of both optic nerves at the intracranial segments (arrows); (D) coronal contrast-enhanced T1-weighted images with fat suppression showed enhancement of the chiasm (arrow).
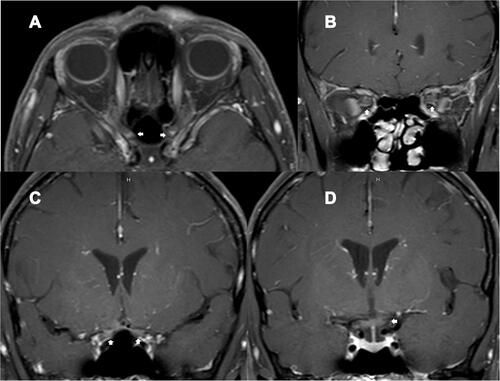
Figure 3 Diagram showing individual trajectories of the CD4 cell count over time in the non-infectious (immune-mediated) ON group. Each color line and the corresponding arrow color represents each patient. Small arrows represent acute ON attacks. Black dots represent antiretroviral initiation. Black rings represent steroid treatments. Three patients (blue, light blue, and purple lines) successfully achieved HIV infection control. They developed acute ON while their CD4 cell counts were rising, and HIV viral load became undetectable. A female patient (black line), who did not receive ART, developed NMOSD-ON while her CD4 cell counts were 371 cells/µL. All the patients in this group did not have opportunistic infections and were responsive to corticosteroid treatments.
