Figures & data
Table 1 Routine Investigations
Figure 1 The patient’s electrocardiogram indicates a wide complex tachycardia (WCT) and atrioventricular dissociation suggestive of ventricular tachycardia. The black arrows indicated the prolonged QRS duration, intrinsicoid deflection, and the red lines underscore the regular WCT.
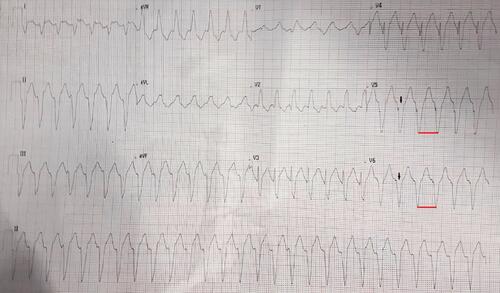
Figure 2 The patient’s cardiac computed tomography angiography cross-sectional view illustrating the absence of the left main coronary artery (encircled in red) with the retrograde opacified left anterior descending (LAD), circumflex arteries (LCx) with their sub-branches, diagonal (D) and obtuse marginal (OM) (labeled).
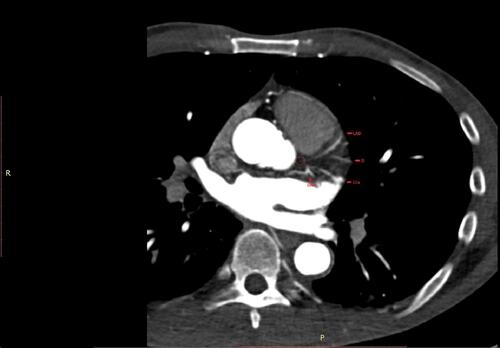
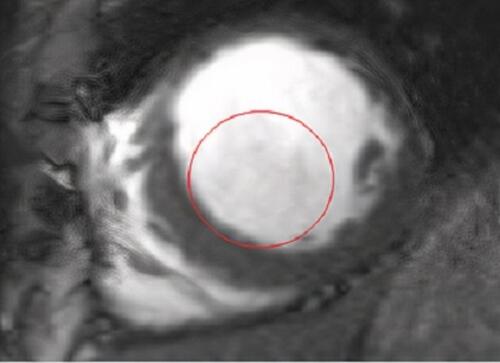
Figure 3 The patient’s cardiac magnetic resonance angiography short-axis view displaying spontaneous echo contrast (encircled in red) suggestive of the depressed left ventricular function.