Figures & data
Figure 1 Histopathology image of bronchial biopsy. Hematoxylin and eosin stain (x100). Non-necrotizing granulomatous reaction was observed, which was not inconsistent with sarcoidosis.
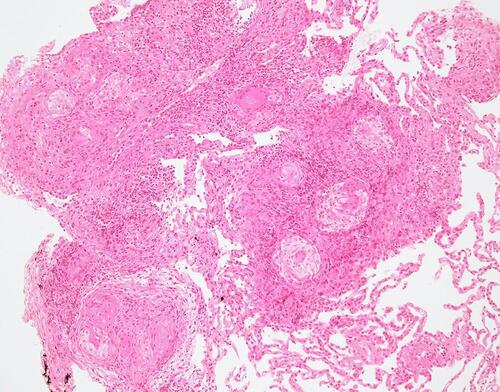
Figure 2 Ocular examination findings in his left eye at the first visit. (A) Fundus photograph shows a white choroidal mass at superior-temporal of the macula. (B) US-B scan showed no evidence of calcification within the mass. (C) EDI-OCT revealed a dome-shaped elevation of the choroid with effacement of the choroidal vessels, and subretinal fluid accumulation. The green arrow shows the location of horizontal section of OCT.
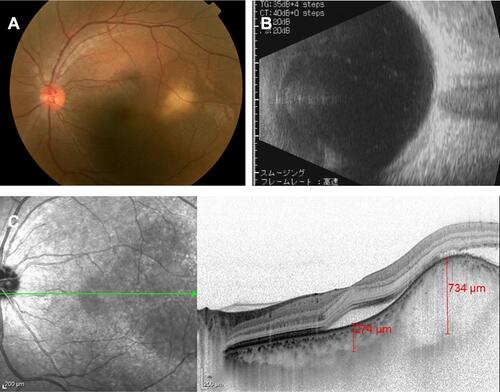
Figure 3 Fluorescein angiography (left) showed hypo-fluorescence in early phase (A) with late leakage (B). Indocyanine green angiography (right) showed hypo-fluorescence throughout the late phase (B).
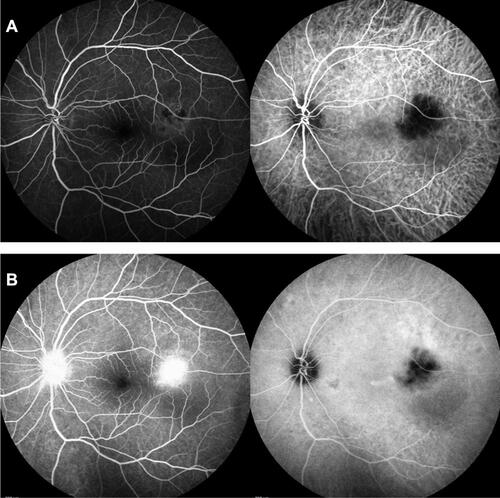
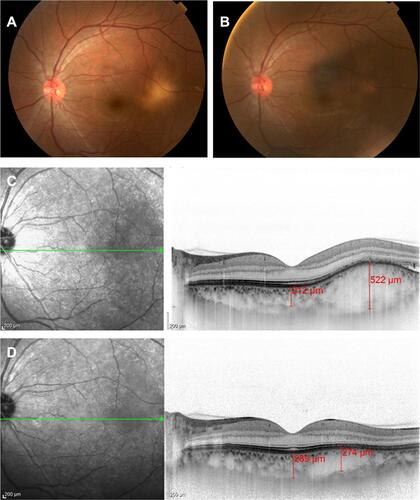
Figure 4 Subretinal fluid was absorbed and mass lesion was shrunk after the administration of the sub-tenon steroid injection. Fundus photograph at 2 weeks (A) and 28 months (B) after the injection. Enhanced depth imaging-OCT at 2 weeks (C) and 10 months (D) after injection. The green arrow shows the location of the horizontal section of OCT.