Figures & data
Figure 1 Pulmonary angiography. (A) Before BPA, (B) during balloon dilatation, (C) after BPA. Organized thrombi in the segmental and subsegmental pulmonary arteries (arrow).
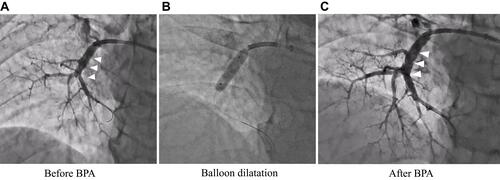
Table 1 Changes in Clinical Parameters from Diagnosis of CTEPH Until 12 Months
Figure 2 Lung perfusion scintigraphy before treatment (A) and after treatment (B).
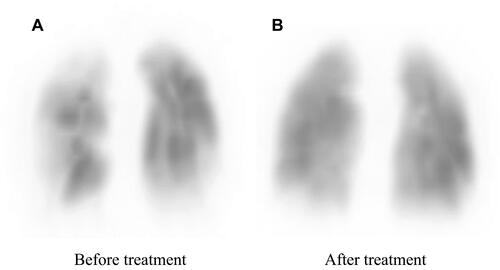
Figure 3 Clinical course of the patient and changes in various circulation parameters and CAVI.
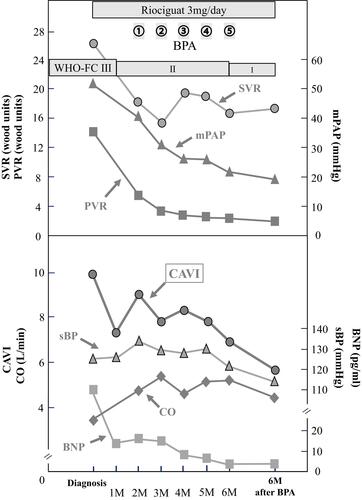
Table 2 Changes in Echocardiographic Findings
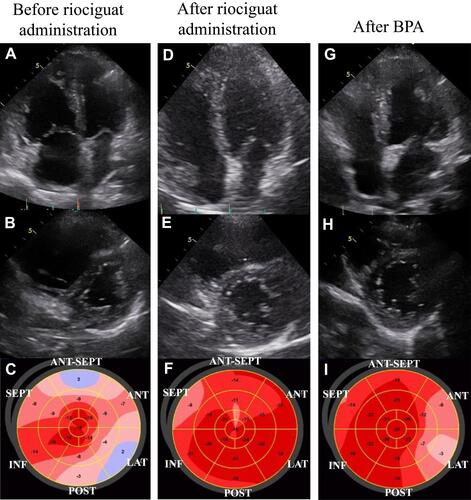
Figure 4 Changes in echocardiographic findings during treatment. Apical 4-chamber view, short axis view and bull’s-eye showing segments of the left ventricle to determine GLS are shown in order. Before riociguat administration (A–C), after riociguat administration (D–F) and after BPA (G–I).