Figures & data
Figure 1 (A) Optic coherence tomography (OCT) of optic nerve head (OHN) shows edema of the right eye optic nerve head (OD), as thickening of retinal nerve fiber layer (RNFL) and ganglion cell complex (GCC) (given in Summary Parameters and temporal-superior-nasal-inferior-temporal (TSNIT) and on table and graphic on the right side of image). Values for the left eye (OS) are normal. (B) Four months after optic neuritis-the right eye optic disc edema is withdrawn and some atrophic changes appeared, most prominently in superior quadrant and as average thinning of RNFL (marked in yellow) and focal loss volume (FLV%) (marked in red) on the right eye (OD), compared to the left eye (OS) normal values.
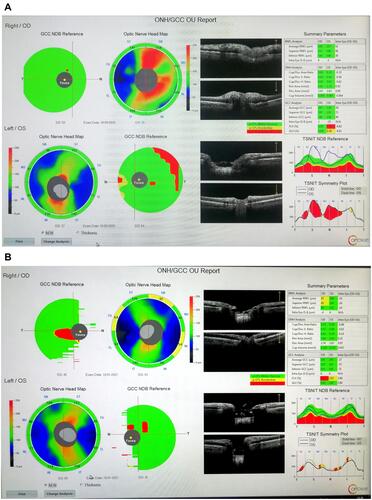
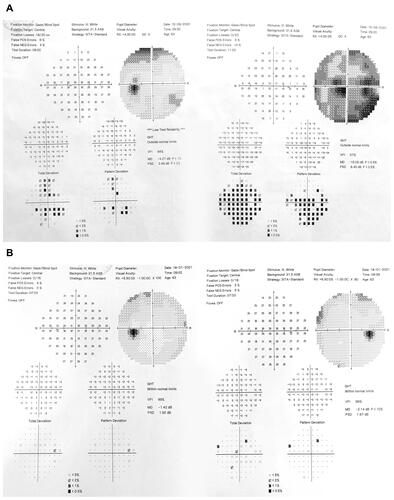
Figure 2 (A) Computed perimetry (visual field) at the end of pulse corticosteroid therapy-on the left eye (left side of figure) there is some sensitivity and pattern reduction (MD and PSD values); on the right eye (right side of figure) variables are still disturbed, but better than initial ones (described in the text): VFI 57%, mean defect (MD) is halved (−15.05 dB) and pattern deviation (PSD) is now differentiated into scotomas. (B) normalization of visual field, four months later, with residual slight reduction of sensitivity on the right eye (right side of figure).