Figures & data
Figure 1 Status post remote pectus excavatum (PEX) repair twenty-two years ago.
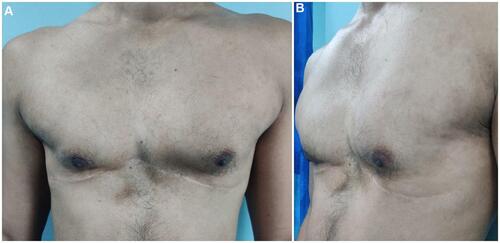
Figure 2 The patient’s 12-lead electrocardiogram (ECG) displaying sinus rhythm with right bundle branch block (RBBB) and left anterior fascicular block (LAFB).
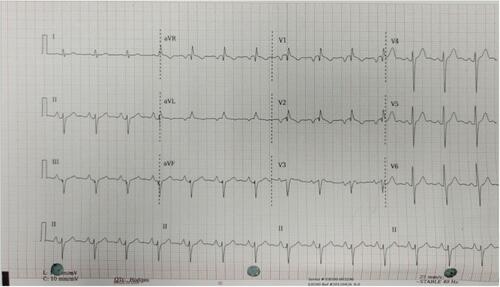
Figure 3 The patient’s chest radiography.
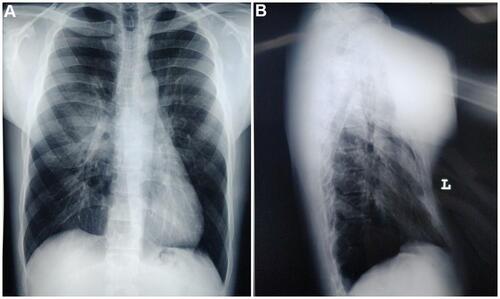
Figure 4 The patient’s cardiac computed tomography angiogram (cCTA).
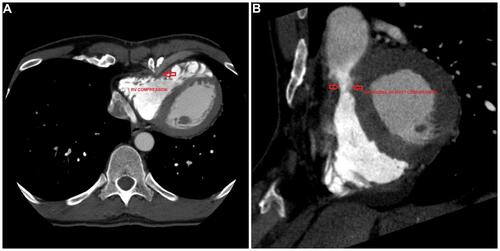
Figure 5 The patient’s cardiac computed tomography angiogram (cCTA) demonstrating a relatively severe Haller index of 5.2 indicated by the ratio of the transverse diameter (the horizontal distance of the inside of the rib cage) and the anteroposterior diameter (the shortest distance between the vertebrae and sternum).
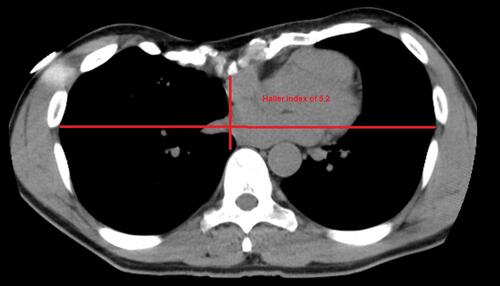
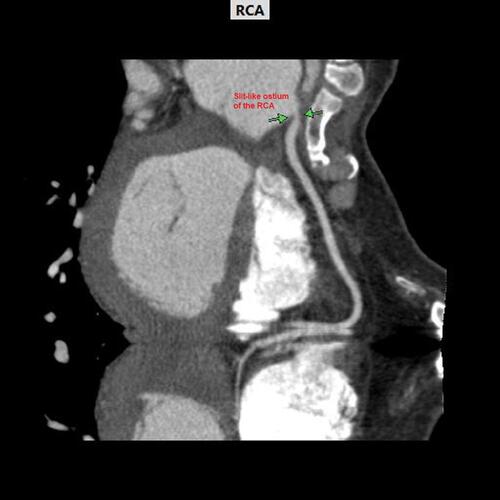
Figure 6 The patient’s cardiac computed tomography angiogram (cCTA) demonstrates the slit-like ostial right coronary artery compression or vasospasm between the green arrows.