
Figures & data
Figure 1 12-Lead ECG (A) at admission showing incomplete right branch block, left anterior-superior divisional block, left axis deviation of the QRS, 2:1 AV block, corrected QT interval prolongation (689ms) and inverted T waves; (B) at discharge showing resolution of T wave inversions and shortening of the QT interval after pacemaker implantation.
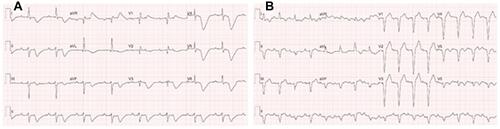
Figure 2 Transthoracic echocardiographic 4-chamber view of the left ventricle in diastole (A) and in systole (B) shows basal hypercontractility (green arrow) and midapical ballooning (yellow arrow).
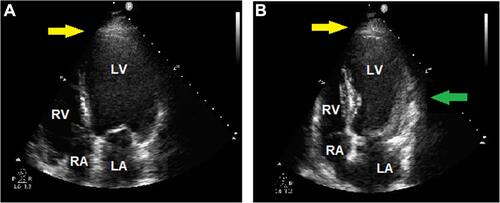
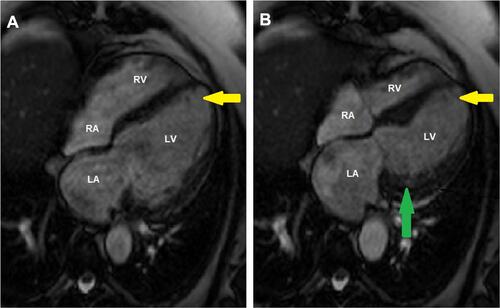
Figure 3 Cardiac magnetic resonance 4-chamber view of the left ventricle in diastole (A) and in systole (B) showing hypercontractility (green arrow) and typical apical ballooning (yellow arrow) in takotsubo syndrome.
Box 1 Learning Points