Figures & data
Figure 1 Various Imaging modalities used in diagnosing Renal artery stenosis in fibromuscular dysplasia.
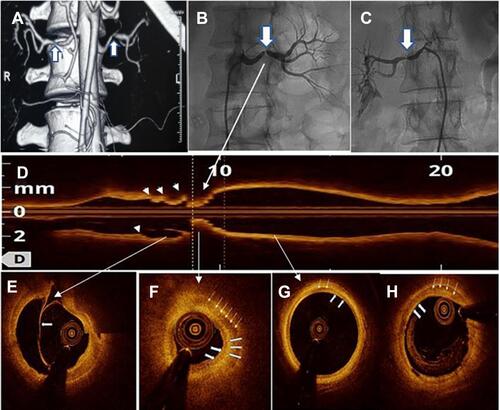
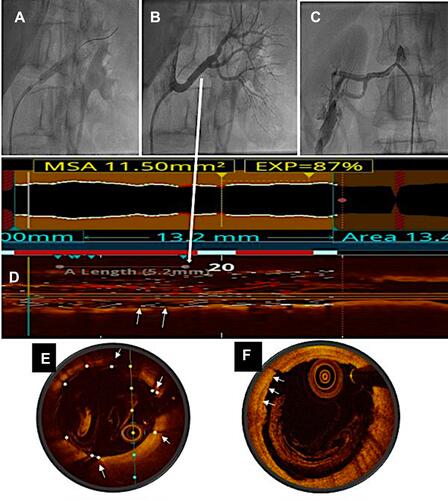
Figure 2 Current bilateral renal angiogram showing significant restenosis (arrows) in the left (A) and right (B) renal arteries. Longitudinal reconstruction of optical coherence tomography (OCT) imaging (C) of left renal artery depicting the corresponding lesion indicated by white arrows. Cross-sectional images showing distal (D) and proximal (F) reference zones are free of disease and measure 4.2mm. The area of focal restenosis on the angiogram correlate with extensive medial and intimal hyperplasia (arrows) on OCT (E), causing 87% area (re) stenosis.
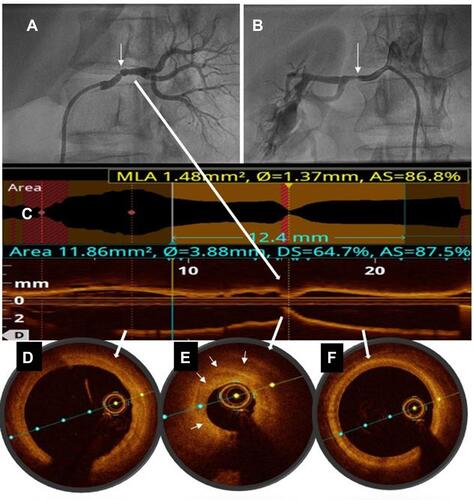
Figure 3 Angiogram showing stent deployment in the left renal artery (A) with an excellent angiographic result (B). The right renal artery shows (C) a good result with balloon angioplasty alone. Longitudinal (D) and cross-sectional (E) OCT images of left renal artery show good stent expansion and apposition (arrows) without residual stenosis. Cross-sectional OCT image (F) of right renal artery after balloon angioplasty shows good result with some intimal tears (arrows) and no residual stenosis (correlate with Image (C)).