Figures & data
Figure 1 Decision tree for an 85-year-old male with heart failure. Value corresponds to the number of samples in each node that belong to HFpEF and HFrEF, respectively. Gini is a measure of the impurity at each node and parallels the disparity of the values at each location. Diabetes is a Boolean value where 0 is false and 1 is true.
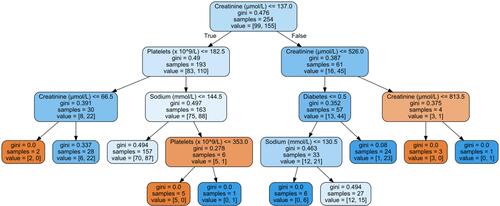
Figure 2 Single arbitrarily chosen decision tree from the random forest approach for an 85-year-old male with heart failure. Value corresponds to the number of samples in each node that belong to HFpEF and HFrEF, respectively. Gini is a measure of the impurity at each node and parallels the disparity of the values at each location. Anemia and hypertension are Boolean values where 0 is false and 1 is true.
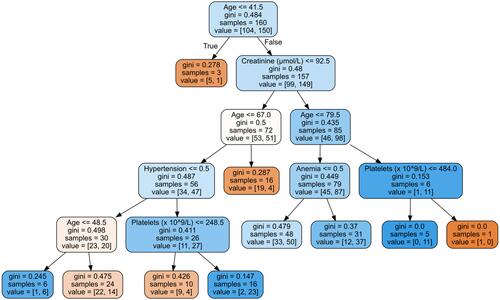
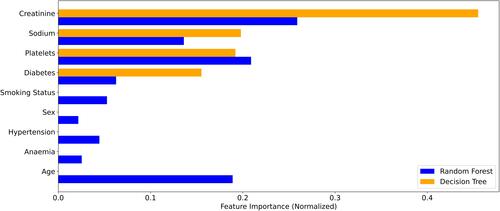
Figure 3 Comparison of feature importance between decision tree and random forest ML in an 85-year-old male with heart failure. This has been normalized so that the total attribute contribution for each corresponding method adds up to 1.