Figures & data
Figure 1 Clinical pictures of the knee. There was no obvious sign of infection and these pictures show markedly limitations of knee motion. Knee flexion was limited to 80 degree and extension limited to 30 degrees.
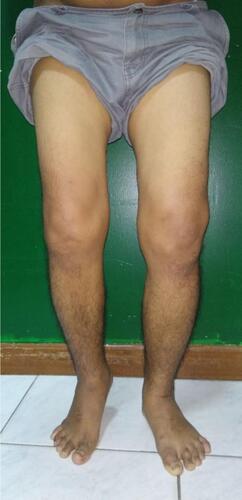
Table 1 Pre-Operative Laboratory Result
Figure 2 Plan X-ray of the knee shows early arthritic changes on the affected right knee compared to the left knee. On lateral view there is a button that remain on its position on the femoral side.
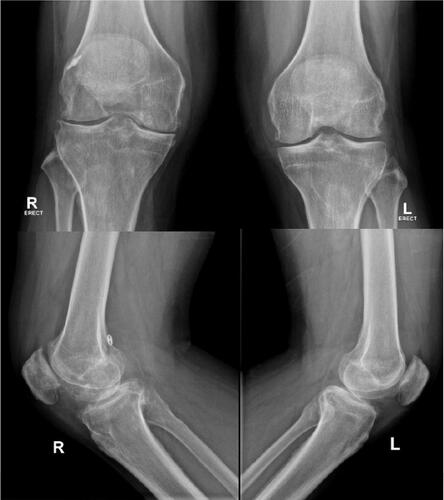
Figure 3 Knee joint MRI of T2 weighted sagittal view show a nodular tissue formation on the posterior part of tibiofemoral joint (white arrow).
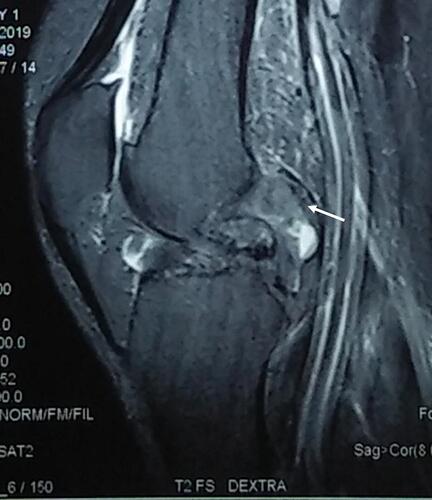
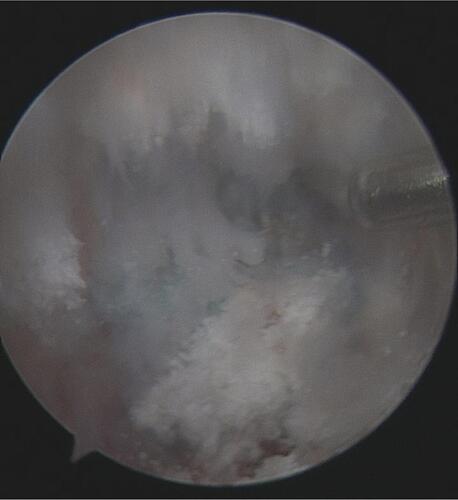
Figure 4 Arthroscopic finding: (A) Abundant crystal urate attached to the entire surface of synovium; (B) Crystal urate envelop the articular surface; (C) Intraarticular tophus formation; (D) Crystal urate comes out from the broken tophus.
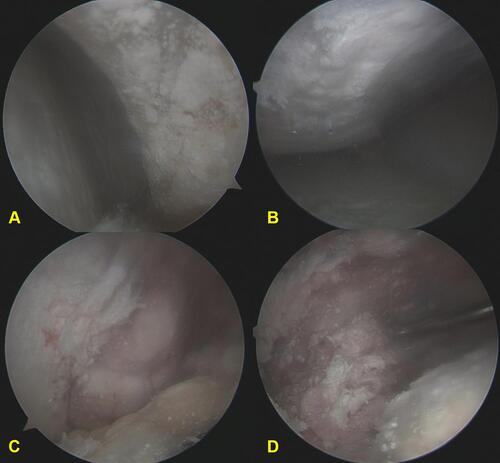
Figure 5 This arthroscopic view shows that loss of ACL graft on its femoral footprint, there was a suture left on the tunnel surface.