Figures & data
Figure 1 Electrocardiograph analysis showed mild ST-segment elevation and abnormal Q waves in III and aVF; sinus tachycardia and complete right bundle branch block.
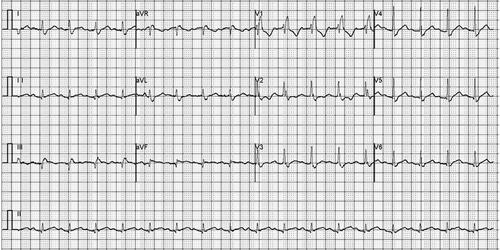
Figure 2 Pulmonary computed tomographic angiography (CTA) showed bilateral pleural effusion and inflammation (pulmonary window and mediastinal window).
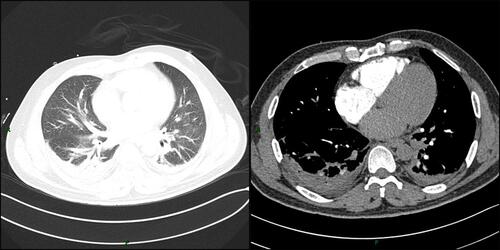
Figure 3 Changes in temperature and blood pressures during hospitalization.
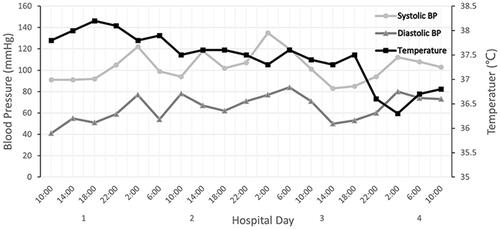
Figure 4 Changes in inflammatory markers during hospitalization.
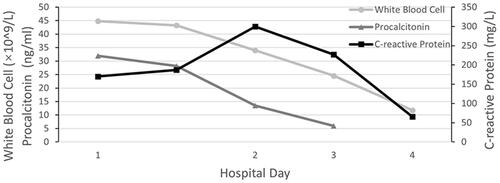
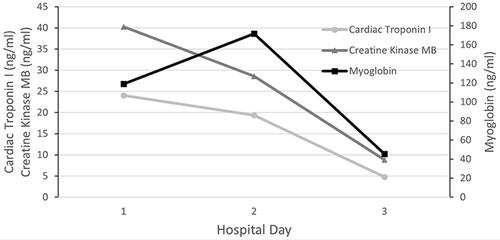
Figure 5 Changes in myocardial injury markers during hospitalization.