Figures & data
Figure 1 Ancillary testing of the left eye on the patient’s initial presentation, revealing a hemangioma superior to the disc with secondary subretinal fluid in the macula. These were visualized with (A) fundus photos, wide-field fluorescein angiography and indocyanine green angiography, respectively; (B) optical coherence tomography over the macula showing foveal detachment (-->) and choroidal elevation from hemangioma (*); (C) B-scan ultrasonography and A-scan ultrasonography.
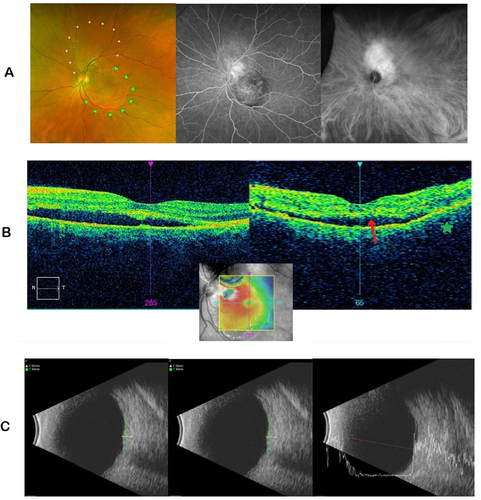
Figure 2 Optical coherence tomography studies over the macula on the day of treatment with half-fluence PDT and aflibercept (A), three weeks post-treatment (B), five weeks post-treatment (C), and eight weeks post-treatment (D). Columns left to right: horizontal OCT cuts over the fovea, contour map of the central macula, and difference map of macular thickness (microns) between each sequential scan.
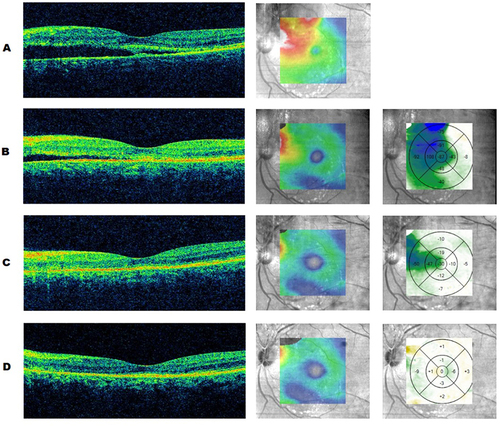
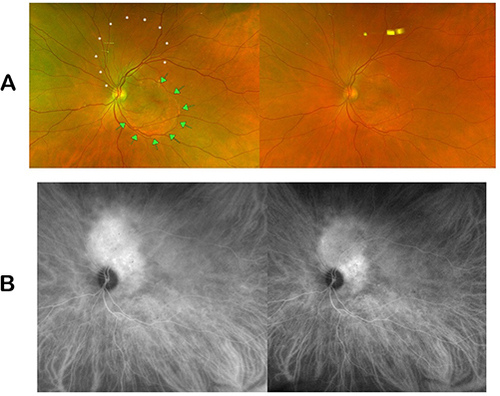
Figure 3 Comparison of (A) fundus images and (B) indocyanine-green angiographic images pre- and post-treatment with half-fluence PDT and aflibercept taken at presentation and eleven and a half weeks after treatment.