
Figures & data
Figure 1 CFP showing a optic disc melanocytoma with black to dark brown slightly elevated mass lesion of the left optic disc. (A) B-scan ultrasonography of the left eye showing a hyperechoic small dome shaped lesion. (B) FAF revealed a totally hypofluorescent mass. (C) FA showed the hyperfluorescence staining of PHOMS at the superonasal rim of the left optic disc and diffuse blocked hypofluerescence in ODMC (D).
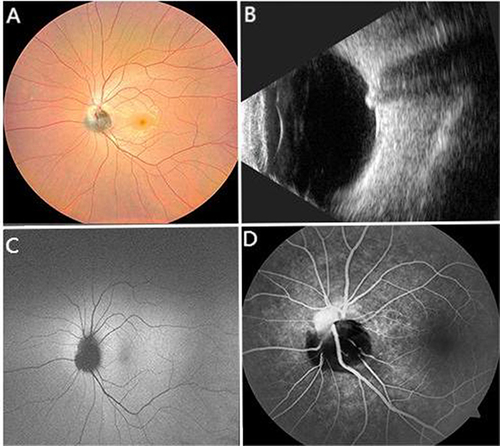
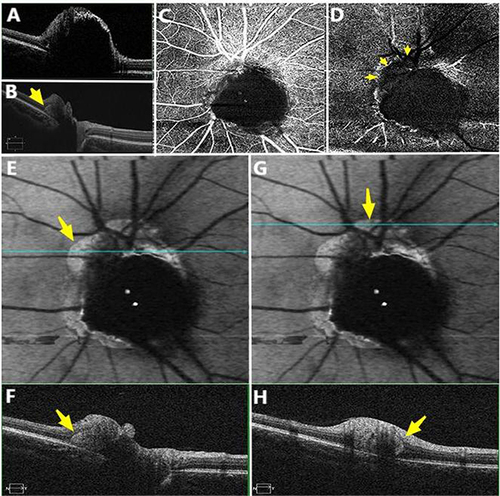
Figure 2 SD-OCT images of ODMC (A) and PHOMS (yellow arrow, (B). OCTA images showing superficial capillary plexus (C) and the blood flow signal of the deep capillary plexus was decreased in PHOMS (yellow arrow, (D). PHOMS showing peripapillary hyperreflective bright areas on en-face Min-IP image corresponding to B-scan OCT image (E, F, G and H, yellow arrow).
Data Sharing Statement
The original contributions presented in the study are included in the article, further inquiries can be directed to the corresponding author.