Figures & data
Figure 1 Electrocardiogram images showed changes in electrocardiogram during the course of the disease. (a) Electrocardiogram of the patient before immunotherapy. (b) Electrocardiogram of the patient after seven weeks of immunotherapy: Appeared tachycardia, complete right bundle branch block, and abnormal ST-T segment.
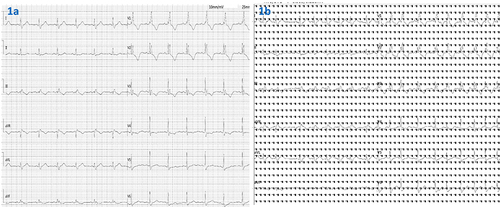
Figure 2 Changes in urea nitrogen, creatinine, uric acid, and the amino-terminal precursor of brain natriuretic peptide (NT proBNP) during the course of the disease. The figure shows a progressive increase in urea nitrogen, creativity, uric acid, and the amino terminal precursor of brain natural peptide (NT proBNP) of the patient over time.
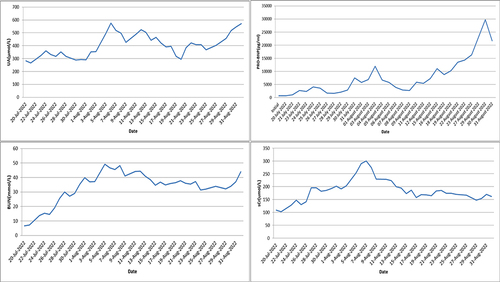
Figure 3 Changes in Creatine kinase (CK), creatine Isozyme (CK mb), Lactate dehydrogenase (LDH), lactate dehydrogenase Isozyme (LDH1, LDH2), a-hydroxybutyrate dehydrogenase (a-hbdh). The figure shows a significant increase in relevant indicators in the early stages of the patient’s onset. After 3 days of high-dose corticosteroids therapy, it quickly decreased and maintained at a lower level.
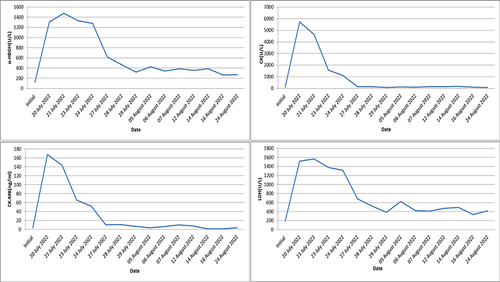
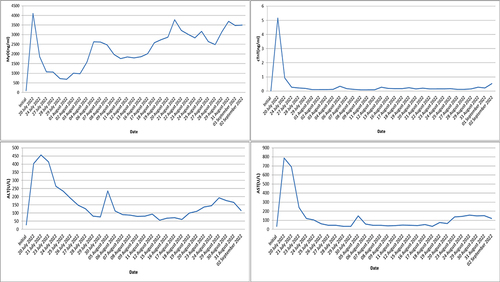
Figure 4 Changes in Glutamic pyruvic transaminase (ALT), glutamic oxaloacetic transaminase (AST), Myoglobin (Myo), cardiac troponin T (cTnT). The figure shows a significant increase in relevant indicators in the early stages of the patient’s onset. After 3 days of high-dose corticosteroids therapy, it quickly decreased and maintained at a lower level.