Figures & data
Figure 1 Twelve lead electrocardiography showing sinus rhythm with first-degree AV block, low voltage limb leads, extreme right axis deviation, and absent R wave progression.
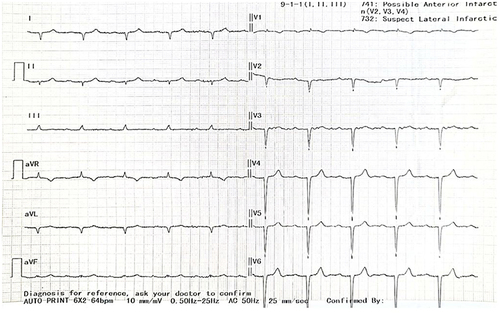
Figure 2 Parasternal long-axis view of transthoracic echocardiography, which was taken from an unusual window at the fourth intercostal space along the mid-axillary line.
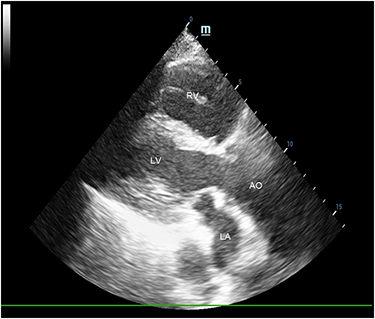
Figure 3 The scout film of CT exhibiting the snoopy sign, which is characterized by a leftward and posterior displacement of the heart as well as an elongation and straightening of the left heart border (red arrows). The right cardiac border is also absent (blue arrows).
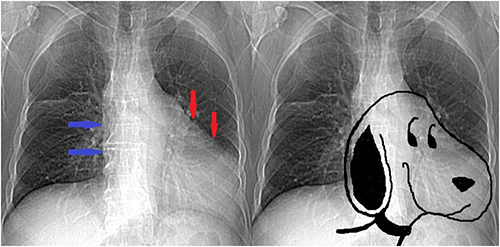
Figure 4 An axial CT scan image demonstrates the heart’s displacement into the left hemithorax and the total lack of pericardium along the left ventricular border (red arrow).
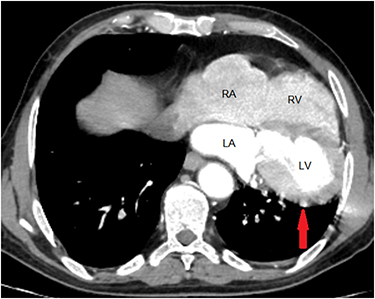
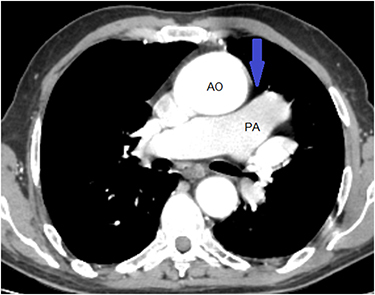
Figure 5 Axial CT scan image revealing lung tissue between the aorta and the main pulmonary artery (blue arrow).