
Figures & data
Figure 1 CFP showing multifocal small white spots surrounding the posterior pole and optic disc with the granular appearance of the fovea in the right eye (A) and the normal left eye (B). FAF showing hyperfluorescence spots in the right eye (C) and the normal left eye (D).
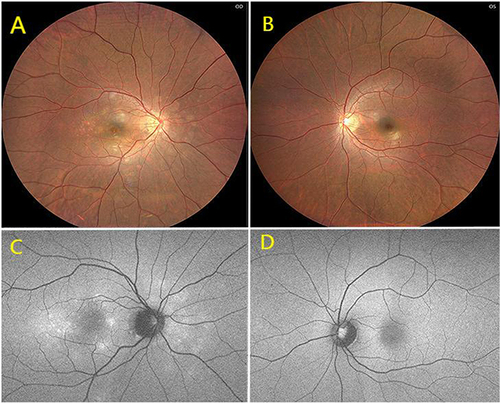
Figure 2 In the right eye, SD-OCT showing disrupted ellipsoid zone, photoreceptor outer segments and interdigitation zone within the fovea (A); the en-face image of the inner segment/outer segment-ellipsoid complex showed hyperreflective spots (B) and Min-IP image exhibited hyperreflective spots (C). In the left eye, no abnormalities were detected either SD-OCT (D) or Min-IP image (E), but hyperreflective spots were observed on the en-face image of the inner segment/outer segment-ellipsoid complex (F, yellow arrow).
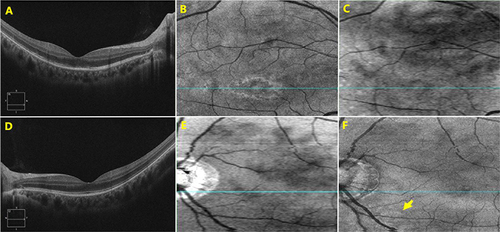
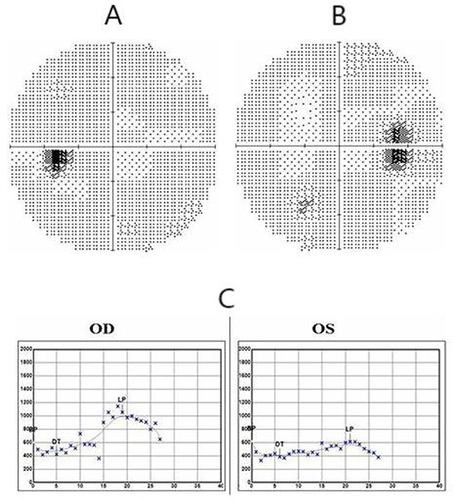
Figure 3 The visual field of left eye was normal (A) and the physiological blind spot in the right eye exhibited a slight enlargement (B). EOG revealed an Arden ratio of 2.5 for the right eye, while the left eye exhibited an Arden ratio of 1.7 (C).
Data Sharing Statement
The original contributions presented in the study are included in the article, and further inquiries can be directed to the corresponding author.