
Figures & data
Figure 1 (A) The Gram stain of the specimen was a cluster of blue-purple, indicating that the organism was Gram-positive bacilli. (B) Weak acid-fast staining was red, indicating that the bacteria was positive for weak acid-fast staining. (C) Dry, rough, and branched bacterial colonies with a little yellowish pigment appeared on the blood agar plate. (D)Under the microscope, the colony morphology was clear.
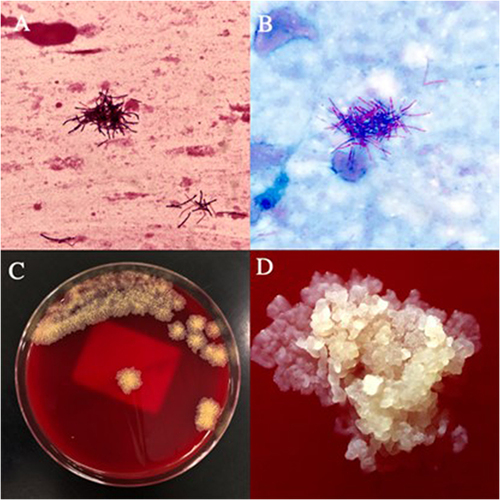
Figure 2 (A) The MALDI-TOF MS spectra. (B) Genome circle map: The first circle shows the size of the genome. The second circle shows the genes predicted by the Forward strand (+) of the genome and the third circle shows the genes predicted by the Reverse strand (-) of the genome. The fourth circle triangle shows the tRNA (the forward and reverse strands are green and blue, respectively), and square represents rRNA (the forward and reverse strands are red and purple, respectively). The fifth circle represents GC Content, and the sixth circle represents GC skew.
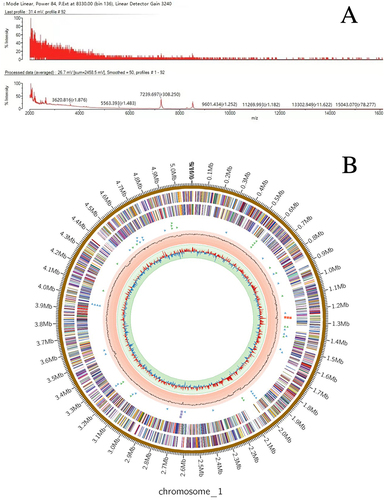
Table 1 Results of Pathogen Susceptibility Test (Gradient Diffusion Method)
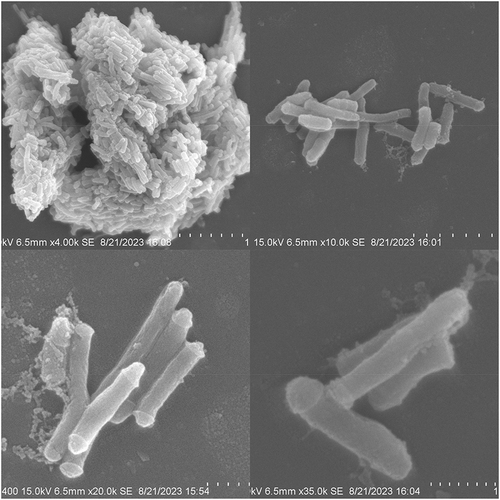
Figure 3 Morphology of Tsukamurella tyrosinosolvens strains under electron microscope: 0.5–1μm in size, nonflagellar, noncapsular irregular bacilli.
Data Sharing Statement
The datasets presented in this study can be found in online repositories. The names of the repository/repositories and accession number(s) can be found below: https://www.ncbi.nlm.nih.gov/, accession number PP916630 (16S rRNA), PRJNA1126077 (High-throughput sequencing).