
Figures & data
Figure 1 Bone scintigraphy showing increased sacral uptake bilaterally (hollow arrows) and pubic bone (solid arrow).
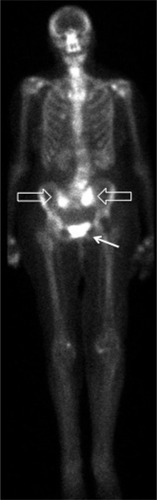
Figure 2 Axial T1-weighted MRI image of sacrum.
Note: Patchy, low-intensity edema evident (arrows).
Abbreviation: MRI, magnetic resonance imaging.
Abbreviation: MRI, magnetic resonance imaging.
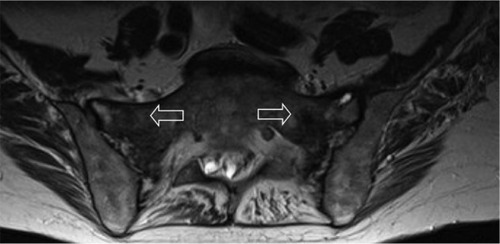
Figure 3 CT images of sacrum.
Notes: (A) axial and (B) sagittal views demonstrating cortical breaks with mottled sclerosis/lucency (arrows).
Abbreviation: CT, computed tomography.
Abbreviation: CT, computed tomography.
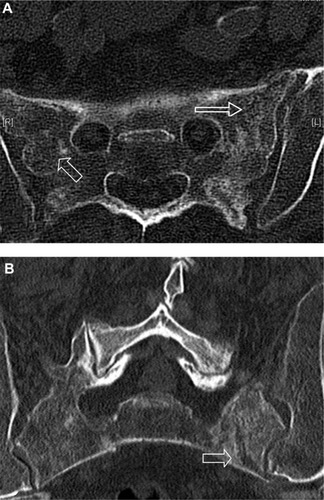
Table 1 Summary of articles published on the imaging modalities utilized for the investigation of SIFs
Table 2 A selection of previously reported case series on the various treatments of SIFs