Figures & data
Table 1 Laboratory data on first visit to Chiba University Hospital
Figure 1 Contrast-enhanced CT revealed hepatomegaly and heterogeneity of contrast staining.
Notes: (A) Plain phase. (B) Early phase. Narrow intrahepatic portal vessels are shown (white arrow). (C) Late phase. Hepatic vessels are unclear. (D) FDG-PET/CT revealed heterogeneous uptake of FDG into the liver. SUV maximum range was: 3.2–3.7; 2.8–3.2; and 1.6–2.5 in the left, right lobes of the liver, and the spleen, respectively.
Abbreviations: CT, computed tomography; FDG, fluorodeoxyglucose; PET, positron emission tomography; SUV, standard uptake value.
Abbreviations: CT, computed tomography; FDG, fluorodeoxyglucose; PET, positron emission tomography; SUV, standard uptake value.
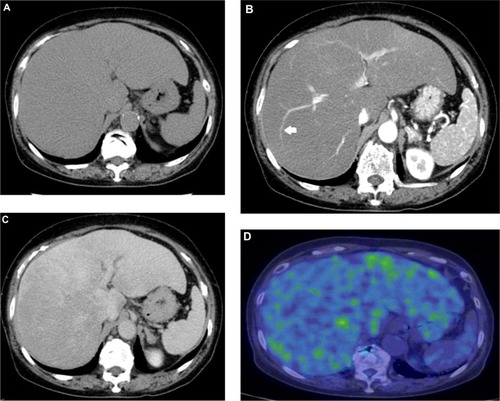
Figure 2 MRCP (A) and ERCP (B and C) revealed narrowed whole intrahepatic bile ducts with smooth walls (white arrows).
Abbreviations: MRCP, magnetic resonance cholangiopancreatography; ERCP, endoscopic retrograde cholangiopancreatography.
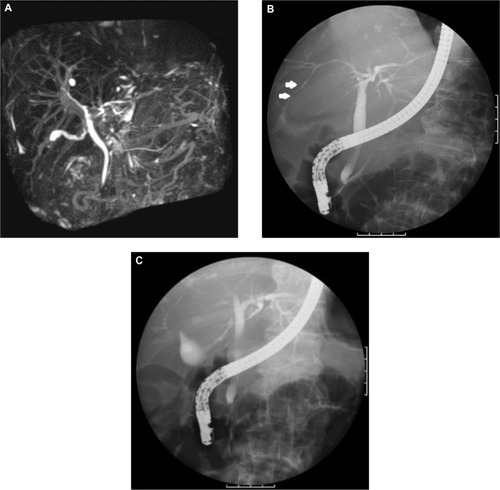
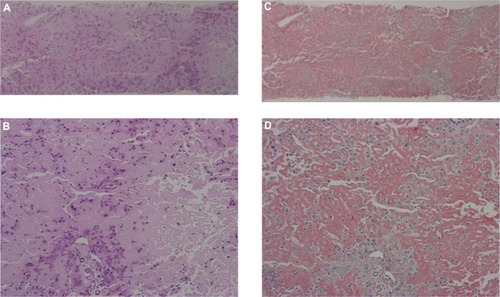
Figure 3 Liver biopsy showing deposition of amyloid protein.
Notes: Hematoxylin and eosin stain, original magnification 20× (A) and 100× (B); Congo red stain, 20× (C) and 100× (D).