Figures & data
Figure 1 Twelve-lead rest electrocardiogram showing positive QRS complexes (with upright P and T waves) in aVR, inversion of all complexes in lead I, and absent R wave progression in the chest leads (dominant S waves throughout).
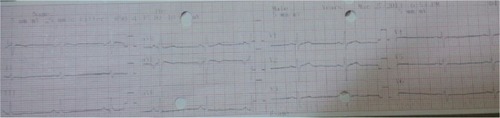
Figure 2 Twelve-lead electrocardiogram showing supraventricular tachycardia with a regular, narrow QRS tachycardia at a rate of 170 bpm, during which the P wave was indiscernible, in a patient with dextroposition of the heart.
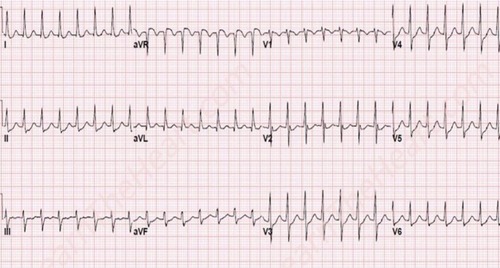
Figure 3 A lung window setting computed tomography scan.
Abbreviations: LA, left atrium; LV, left ventricle; RV, right ventricle.
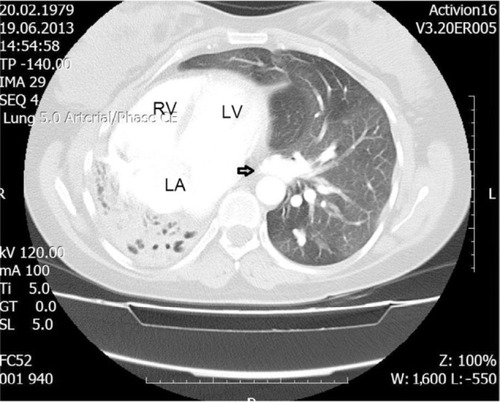
Figure 4 Fluoroscopic view in the 15° anteroposterior projection after contrast injection.
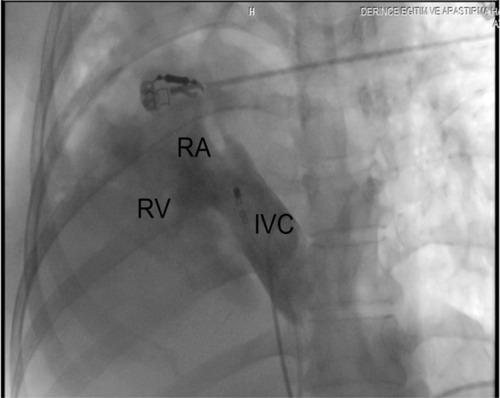
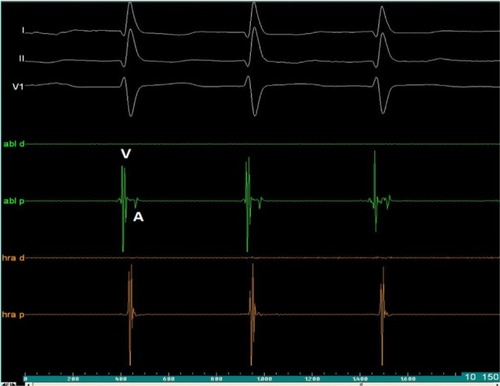
Figure 5 Intracardiac recording.
Abbreviations: A, atrial intracardiac electrogram; abl d, distal ablation electrode; abl p, proximal ablation electrode; hra d, high right atrium distal; hra p, high right atrium proximal; V, ventricular intracardiac electrogram.
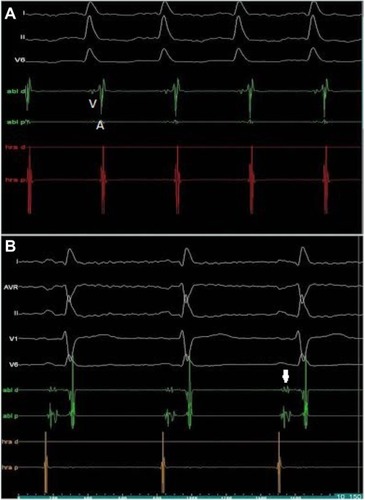
Figure 6 Fluoroscopic image with a modified anteroposterior projection showing an ablation catheter at the region of the slow pathway (Abl) and a quadripolar diagnostic catheter on the His bundle position (D).
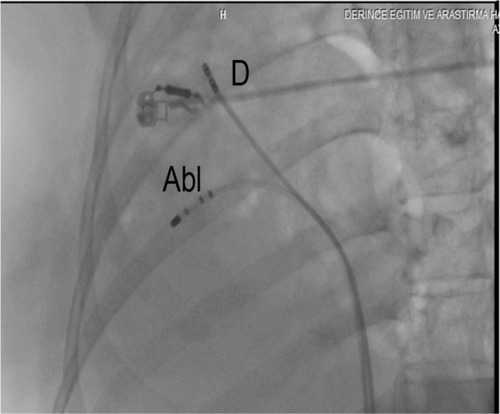
Figure 7 Fluoroscopic image with a modified anteroposterior projection showing an ablation catheter at the region of the coronary sinus ostium (CS os) and a quadripolar diagnostic catheter on the right ventricular outflow tract (RVOT).
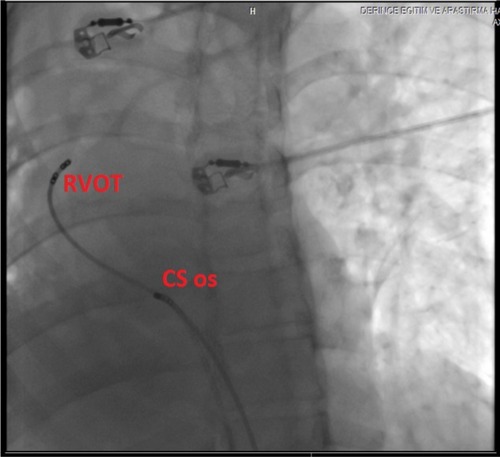
Figure 8 Intracardiac electrogram of junctional rhythm after radiofrequency ablation of the slow pathway.