Figures & data
Figure 1 The patient’s ECG upon admission.
Notes: Twelve-lead ECG upon admission revealed wide QRS tachycardia with RBBB morphology, south-west axis, monophasic R wave in aVR (arrow-head), and atrioventricular dissociation (arrow).
Abbreviations: ECG, electrocardiogram; RBBB, right bundle branch block; aVR, augmented vector right.
Abbreviations: ECG, electrocardiogram; RBBB, right bundle branch block; aVR, augmented vector right.
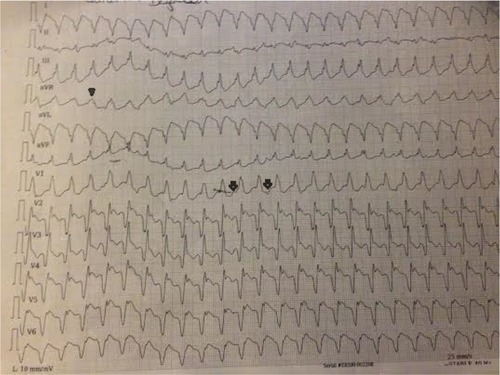
Figure 2 Coronary angiographic views of the patient.
Notes: Coronary angiogram shows left anterior descending artery and left circumflex artery; the arrow demonstrates an implanted coronary stent (A). Coronary angiogram shows right coronary artery (B).
Abbreviations: LAD, left anterior descending artery; LCx, left circumflex artery; RCA, right coronary artery.
Abbreviations: LAD, left anterior descending artery; LCx, left circumflex artery; RCA, right coronary artery.
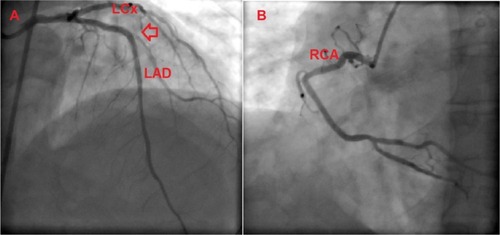
Figure 3 Tracing from the electrophysiology study showing ventricular tachycardia intracardiac electrogram during ventricular tachycardia.
Notes: I, II and V1 were surface electrocardiography leads. HRA and ABL are intracardiac leads (HRA is the diagnostic catheter and placed in high right atrium, ABL is the ablation catheter and placed in the left ventricle).
Abbreviations: HRA, high right atrium; ABL, ablation catheter; A, atrium; V, ventricle; d, distal; p, proximal.
Abbreviations: HRA, high right atrium; ABL, ablation catheter; A, atrium; V, ventricle; d, distal; p, proximal.
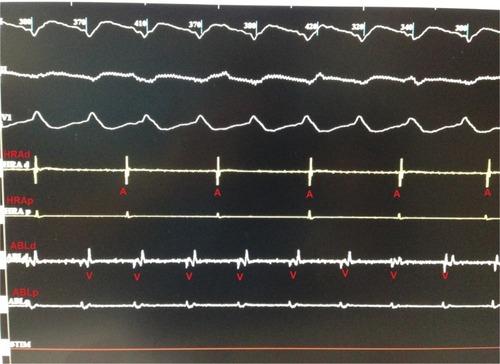
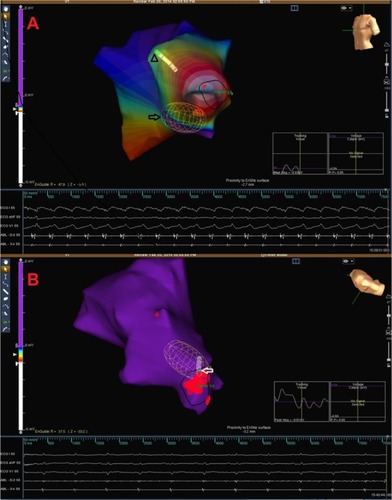
Figure 4 Electrocardiograms and endocardial activation maps.
Notes: Electrocardiograms and endocardial activation map of ventricular tachycardia. Arrow indicates the Ensite Array catheter. The ablation catheter (arrowhead) is seen as shaded (A). Electrocardiograms and endocardial activation map after successful ablation. The ablation catheter (arrow) is in the region of sinus rhythm is achieved (B).