Figures & data
Figure 1 Fluorescein angiography and optical coherence tomography studies for case 1 (Irvine-Gass syndrome).
Notes: (A) Cystoid macular edema, macular contour, and macular thickness at presentation. (B and C) Reduced macular leakage on the fluorescein angiogram; reduced macular contour and thickness; and macular change analysis (B) 13 days following treatment and (C) 1 year following treatment. The difference maps are made between the intervals between the figures. The first difference map shows the difference between day 13 and day 0. The second difference map shows the difference between 1 year and day 13.
Abbreviations: T, temporal; N, nasal.
Abbreviations: T, temporal; N, nasal.
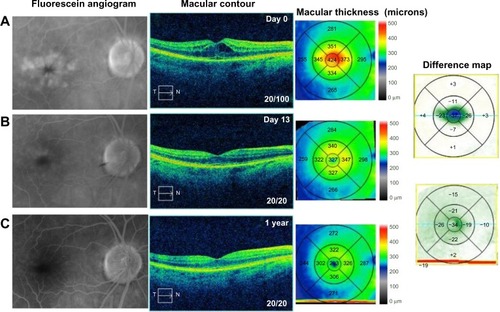
Figure 2 Fluorescein angiography and optical coherence tomography studies for case 2 (Irvine-Gass syndrome).
Notes: (A) Cystoid macular edema, macular contour, and macular thickness at presentation. (B) Macular contour and thickness and macular change analysis 14 days following treatment. (C) Decreased macular leakage; decreased macular contour and thickness; and macular change analysis 2 months following treatment.
Abbreviations: T, temporal; N, nasal.
Abbreviations: T, temporal; N, nasal.
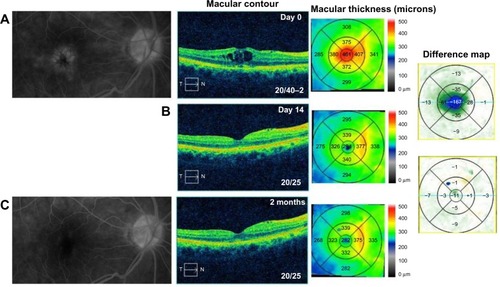
Figure 3 Fluorescein angiography and optical coherence tomography studies for case 3 (Irvine-Gass syndrome).
Notes: (A) Cystoid macular edema, macular contour, and macular thickness at presentation. (B) Macular contour and thickness and macular change analysis 14 days following treatment. (C) Decreased macular leakage; decreased macular contour and thickness; and macular change analysis 3 months following treatment.
Abbreviations: T, temporal; N, nasal.
Abbreviations: T, temporal; N, nasal.
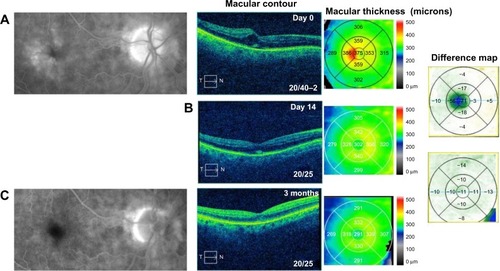
Figure 4 Optical coherence tomography studies for case 4 (diabetic retinopathy).
Notes: (A) Macular contour and thickness at presentation. (B) Macular contour and thickness and macular change analysis 14 days following treatment. (C) Increased cystoid macular edema with cessation of treatment and (D) improvement with resumption of treatment.
Abbreviations: S, superior; I, inferior.
Abbreviations: S, superior; I, inferior.
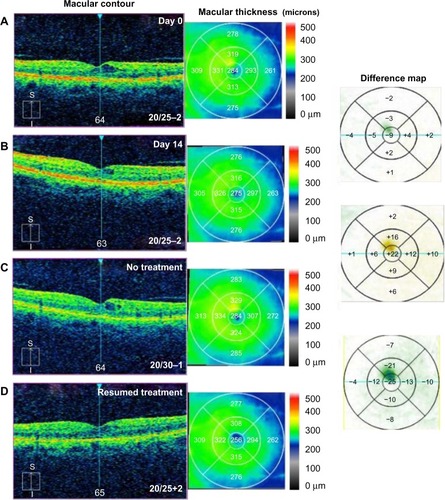
Figure 5 Optical coherence tomography studies for case 5 (uveitis).
Notes: (A) Macular contour and thickness at presentation. (B) Macular contour, thickness, and macular change analysis (difference map) following treatment. Yellow asterisks indicate artifacts.
Abbreviations: T, temporal; N, nasal; OD, oculus dexter; OS, oculus sinister.
Abbreviations: T, temporal; N, nasal; OD, oculus dexter; OS, oculus sinister.
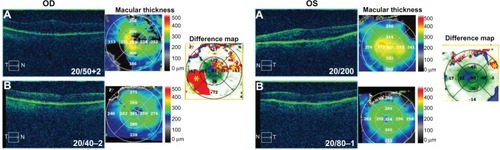
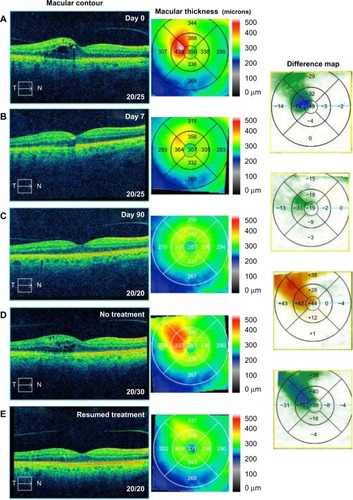
Figure 6 Optical coherence tomography studies for case 6 (branch retinal vein occlusion).
Notes: (A) Macular contour and thickness at presentation. (B and C) Macular contour and thickness and macular change analysis (B) 7 days and (C) 90 days following treatment. (D) Increased cystoid macular edema with cessation of treatment and (E) improvement with resumption of treatment.
Abbreviations: T, temporal; N, nasal.
Abbreviations: T, temporal; N, nasal.