Figures & data
Figure 1 Facial images of the female infant with optic-nerve hypoplasia and anterior segment abnormality associated with facial cleft.
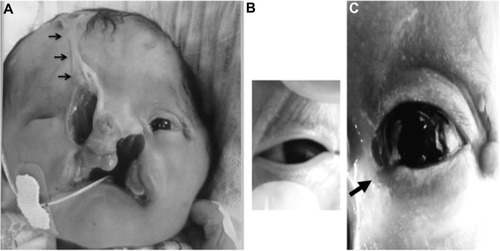
Figure 2 Axial (A) and sagittal (B) T2-weighted magnetic resonance images reveal a huge interhemispheric cyst-associated ventriculomegaly and agenesis of the corpus callosum.
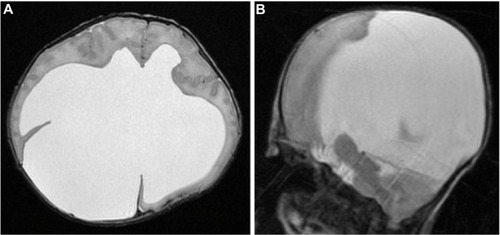
Figure 3 Image showing the anterior segment of the right eye, with inferior to central corneal opacity (subepithelial to deep stroma) with vascularization (arrows) in the corneal stroma, pseudopterygium (white arrowhead), downward corectopia, and anterior synechia (black arrowhead).
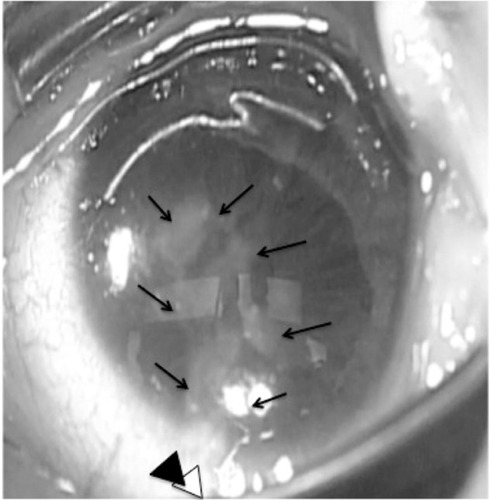
Figure 4 (A) Fundus image of the patient’s right eye. The DM/DD ratio was ~4.0. (B) Enlarged view of the right optic-nerve disc showing a tilted disc and a double-ring sign (arrows). (C) Left-eye fundus image. The DM/DD ratio was ~2.8.
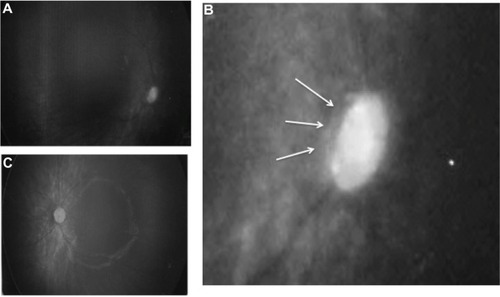
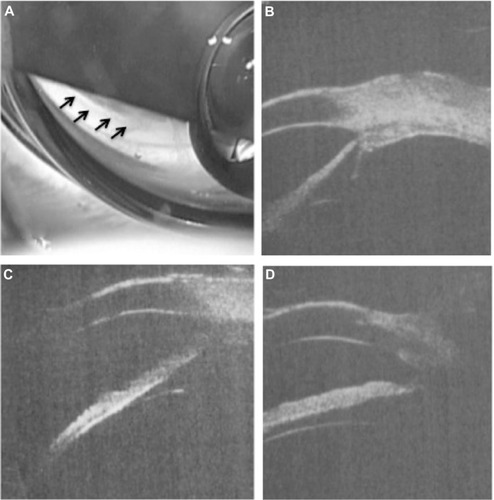
Figure 5 (A) Gonioscopy finding and UBM images of the inferior, (B) temporal, (C) nasal, and (D) inferior sides.
Abbreviation: UBM, ultrasound biomicroscopy.