Figures & data
Figure 1 Flow chart of subjects selected for inclusion into the study.
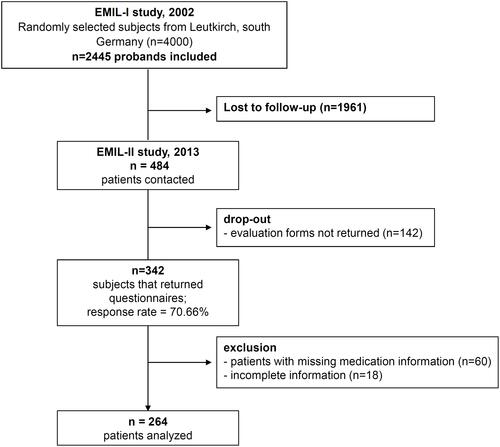
Table 1 Characteristics of the Analysed Study Population (n=264)
Figure 2 Gender distribution in the different age groups.
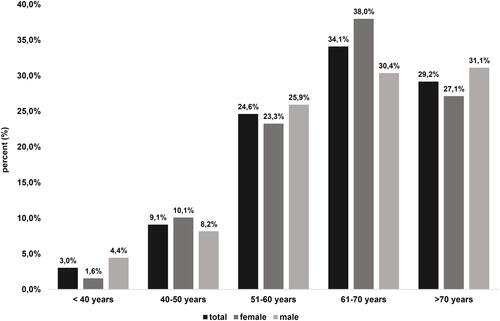
Table 2 Drug Interactions in Germany (n=264) in a Random Sample Population Stratified by Gender and Non-Prescription and as Needed Medications
Table 3 Drug Interactions in a Random Sample Population in Germany (n=264), Stratified by Age
Figure 3 Percentage of detected drug interactions, stratified by gender and body mass index.
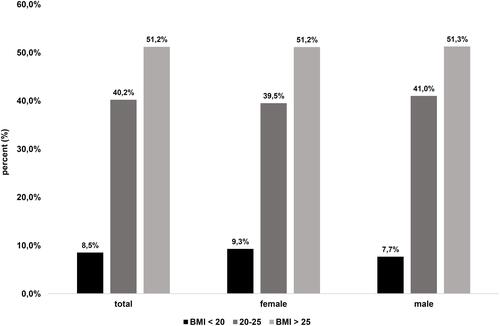
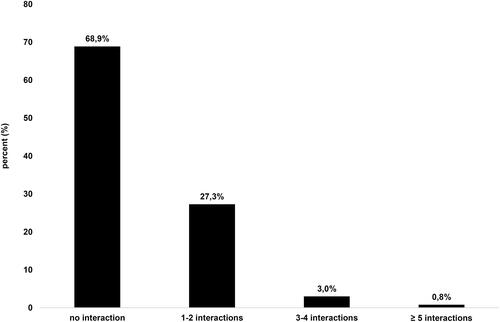
Figure 4 Percentage of severe and moderately severe drug interactions by number of interactions.