Figures & data
Figure 1 Map of Tanzania showing the five administrative regions (shaded) studied.
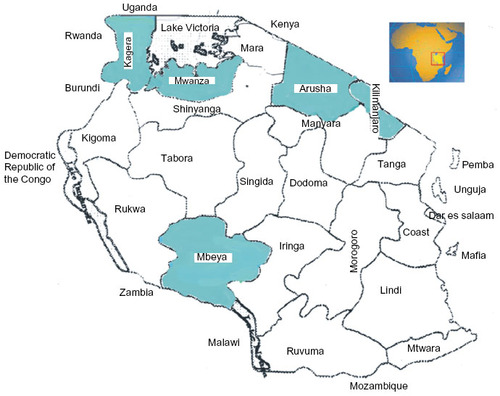
Table 1 Aantibiotics from the Kagera, Aarusha, and Kilimanjaro administrative regions of Tanzania
Table 2 Aantibiotics from Mwanza and Mbeya administrative regions of Tanzania
Table 3 Drugs, manufacturers, and samples
Figure 2 Antibacterial profiles of control antibiotics and test batches of CIP, AMP, and GEN.
Abbreviations: CI, confidence interval; SALM, Salmonella typhi; KLEleB, Klebsiella spp.; SsTAaP, Staphylococcus aureus; ECecOLl, Escherichia coli; PSEseU, Pseudomonas aeruginosa; CIP, ciprofloxacin; co-CIP, control ciprofloxacin; AMP, ampicillin; co-AMP, control ampicillin; GEN, gentamicin; co-GEN, control gentamicin.
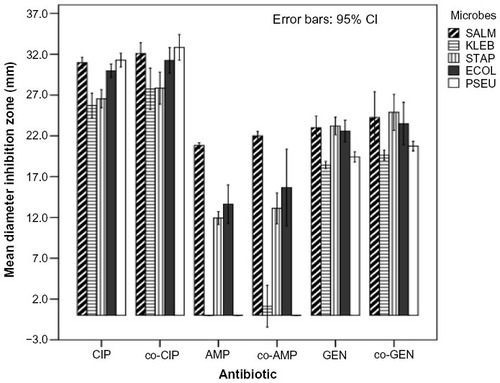
Figure 3 Antibacterial profiles of control antibiotics and test batches of AMO, AMCL, and CTX.
Abbreviations: CI, confidence interval; SALM, Salmonella typhi; KLEleB, Klebsiella spp.; SsTAaP, Staphylococcus aureus; ECecOLl, Escherichia coli; PSEseU, Pseudomonas aeruginosa; co-CcTX, control cotrimoxazole; AaMO, amoxicillin; co-control amoxicillin; AaMCLcl, amoxicillin/clavulanate; co-control amoxicillin/clavulanate; cotrimoxazole.
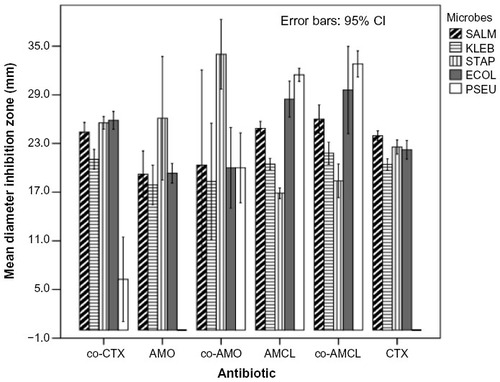
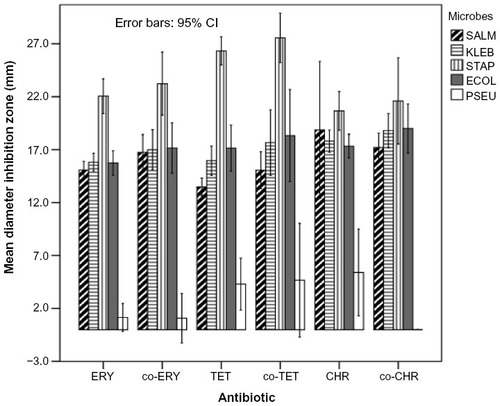
Figure 4 Antibacterial profiles of control antibiotics.
Abbreviations: CI, confidence interval; SALM, Salmonella typhi; KLEleB, Klebsiella spp.; SsTAaP, Staphylococcus aureus; ECecOLl, Escherichia coli; PSEseU, Pseudomonas aeruginosa; EeRY, erythromycin; co-control erythromycin; TEeT, tetracycline; co-TEeT, control tetracycline; CHchR, chloramphenicol; co-control chloramphenicol.