
Figures & data
Figure 1 Flowchart of participants in the study.
Note: *Participants who successfully completed 6 months follow-up were included in the analysis.
Abbreviation: GP, general practitioner.
Abbreviation: GP, general practitioner.
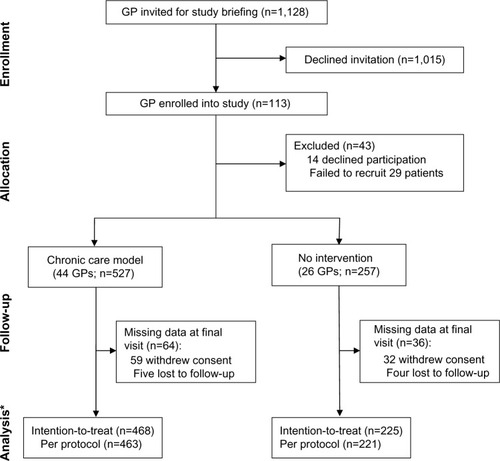
Table 1 Baseline demographics and clinical characteristics of participants in the study
Table 2 Distribution of participants reporting moderate or severe problems in different dimensions and the EQ-5D index scores
Table 3 Patients with a minimum clinically significant change in outcome from baseline to 6 months
Table 4 Results of the GEE regression analyses
Table 5 EQ-5D scores in hypertensive, diabetic, and hyperlipidemic patients