Figures & data
Table 1 Sequence Of Primers Used In This Study
Figure 1 DMF and MMF inhibit the production and release of LPS-mediated IL-1β release from NK92 cells. (A) Time-dependent treatment of NK92 cells with 10 μg/mL LPS upregulates the expression of IL-1β mRNA. *P values (<0.01) compare the mRNA expression in LPS-activated cells (white columns) versus the background control (black columns). (B) Flow cytometry showing representative experiment of the binding of isotype control antibody (red color) and antibody against TLR4 (blue color). Percentages of positive cells are shown. (C) Comparison of mRNA expression of IL-1β among LPS-stimulated cells and those treated with LPS plus DMF or MMF. *P<0.01. (D) LPS-induced IL-1β release and its inhibition by DMF or MMF, as detected by ELISA assay. NK92 cells were incubated with 10 μg/mL LPS either alone or in the presence of 100 μM DMF or MMF in media containing 200 IU/mL IL-2 for 24 h. *P values (<0.01) compare IL-1β release in LPS-activated cells vs cells incubated with LPS plus DMF or MMF. U937 cells treated with 10 μg/mL LPS for 24 h were used as a positive control in these experiments.
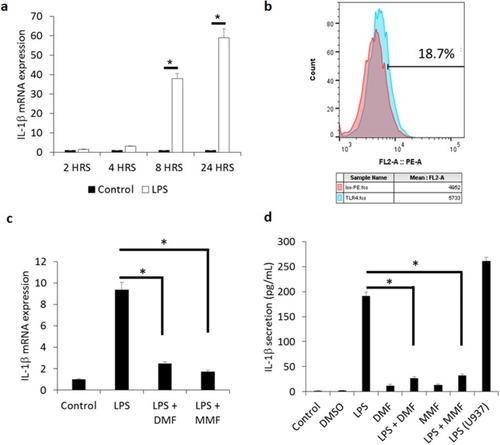
Figure 2 Expression of HCA receptors in NK92 cells. (A) Western blotting was performed on NK92 cell lysates incubated with primary antibodies for HCA1, HCA2, and HCA3 at two different concentrations (1:1000 and 1:5000). (B) Immunofluorescence staining of NK92 cells with specific antibodies for each HCA receptors. Green fluorescence showing binding of the anti-HCA antibodies, whereas blue fluorescence (DAPI staining) shows nuclear staining of the cells, and merged figures showing two images superimposed to each other for each HCA receptor. (C) Flow cytometry showing the expression of HCA1, HCA2, and HCA3. Red histograms showing the binding of the isotype control antibody, whereas blue histograms showing binding of the anti-HCA antibodies. (D) PCR data showing the mRNA expression of HCA receptors in NK92 cells. GAPDH mRNA expression was used as an internal control.
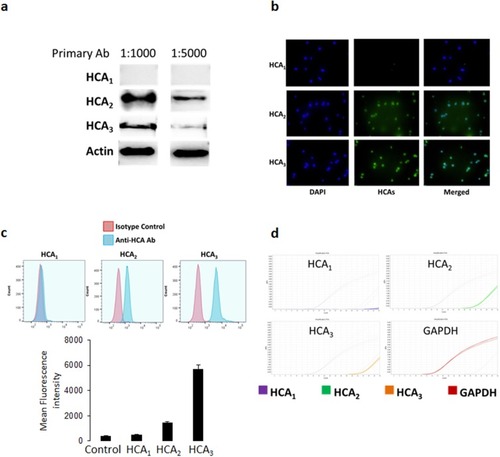
Figure 3 DMF or MMF treatment impairs LPS-activated conversion of procaspase-1 to caspase-1 in NK92 cells. (A) Treatment of NK92 cells with 10 μg/mL LPS for 24 h induced the conversion of procaspase-1 (45kDa) into cleaved subunits of active caspase-1 (22kDa and 12kDa, respectively). Combined treatment of LPS with DMF or MMF showed a reduction in the conversion of procaspase-1 into cleaved active-caspase-1. NK92 cells treated with100 μM DMF or MMF did not induce this conversion. (B) Densitometry calculation of the conversion of procaspase-1 into caspase-1. Actin was used as an internal control.
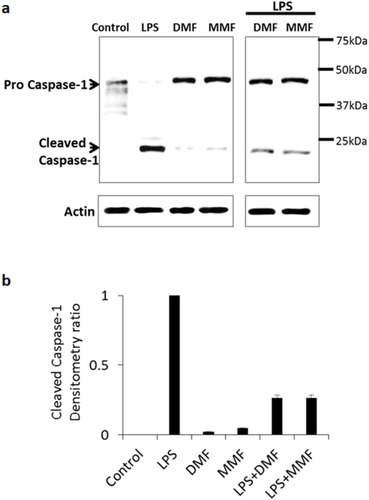
Figure 4 DMF or MMF treatment inhibits LPS-activated expression and activation of gasdermin-D (GSDMD) in NK92 cells. (A) Flow cytometry data showing an increase in the percentages of GSDMD positive cells after LPS treatment, but not post DMF or MMF treatment (B) RT-PCR data showing the mRNA expression of GSDMD gene expression. Cells were either left untreated (Control), treated with 10 μg/mL LPS or LPS plus 100 μM of either DMF or MMF in the presence of 200 IU/mL IL-2. *P<0.01 comparing the gene expression of GSDMD in the presence of LPS vs in the presence of LPS plus DMF or MMF. (C) Cleaving of GSDMD into active GSDMD in untreated (Control) NK92 cells, or cells incubated with LPS, DMF or MMF.
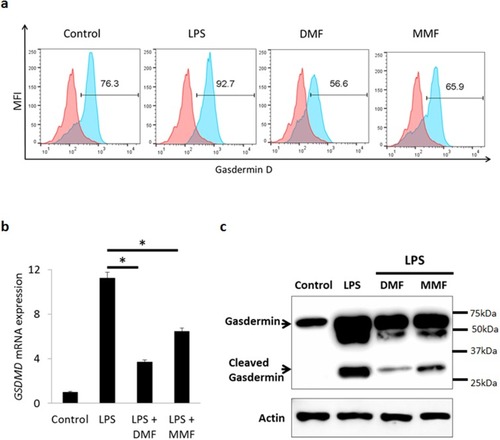
Figure 5 Confocal microscopyimages showing the expression and translocation of GSDMD. NK92 cells were either left untreated (Control) or incubated with 10 μg/mL LPS in the absence or presence of 100 μM of either DMF or MMF, and in the presence of IL-2. DPI was used to stain the nuclei. Arrows indicate pyroptotic bodies after treatment of NK92 cells with LPS.
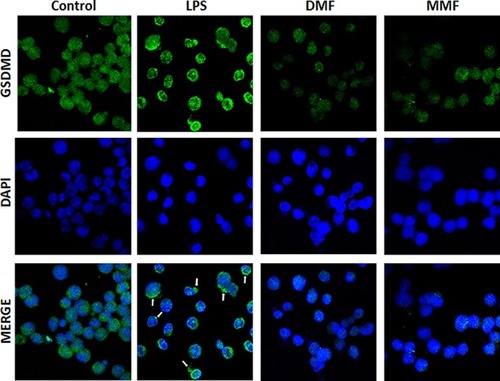
Figure 6 DMF and MMF induced DNMT-mediated methylation-silencing of GSDMD gene. (A) Whole transcriptome analysis data showed increase in DNMT3A and DNMT3B in DMF- or MMF-treated NK92 cells, compared to control cells. (B) Western blotting data also showed an increase in the expression of DNMT3A and DNMT3B in DMF or MMF treated cells but not in LPS treated cells. (C) DMF and MMF increased the expression of DNMT3A and DNMT3B in cells incubated with LPS. (D) Schematic representation of the presence of CpG Islands in the promoter region of GSDMD gene and repression of expression is observed upon methylation of those CGIs. (E) Data from MSP-PCR showed the methylation levels of GSDMD in cells either untreated (Control), or treated with LPS, or LPS plus DMF or MMF in the presence of IL-2 for 24 h. *P<0.01 compares GSDMD promoter methylation levels in LPS-activated cells vs cells incubated with DMF or MMF. Methylation levels were significantly higher in DMF and MMF treated NK92 cells compared to untreated or LPS treated NK92 cells.
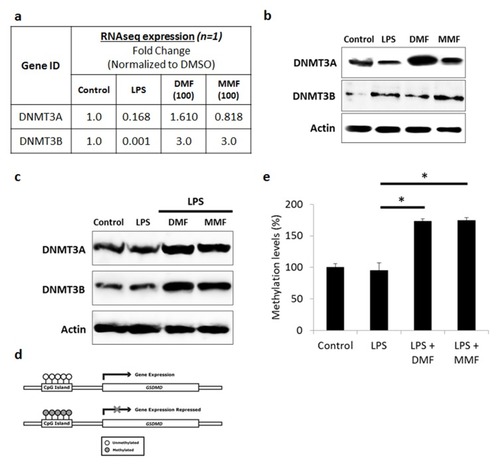
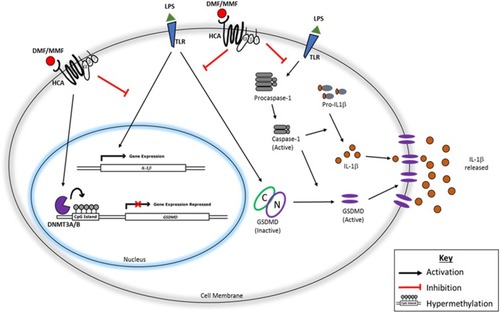
Figure 7 Schematic representation of the pathway leading to IL-1β release from NK92 and its inhibition by DMF or MMF. After binding TLR (and perhaps others), LPS activates caspase-1 which induces the synthesis of IL-1β. Also, LPS upregulates the mRNA for IL-1β, and stimulates GSDMD which induces pyroptosis in the cell membranes allowing the exocytosis of IL-1β. The activities of GSDMD are inhibited by the drug DMF and by MMF plausibly through hypermethylation of GSDMD gene, resulting in impairing the exocytosis of this cytokine, and preventing the pyroptosis of NK92 cells.