Figures & data
Table 1 FDA-Approved Immune Checkpoint Inhibitors (ICIs) for Cancer Treatment
Table 2 Effect of TNFR2-Targeting Treatment on Experimental Tumor Models
Figure 1 TNFR2, PD-L1, and CTLA-4 gene expression profiles across diverse human cancer and normal tissues. The transcriptomic analyses of indicated gene expression by human cancers and paired normal tissues were performed with GEPIA (Gene Expression Profiling Interactive Analysis) online database (http://gepia2.cancer-pku.cn/); is drawn according to specific data in the GEPIA database.Citation199 Log-scale was set to log 2 (TPM+1) in the analysis.
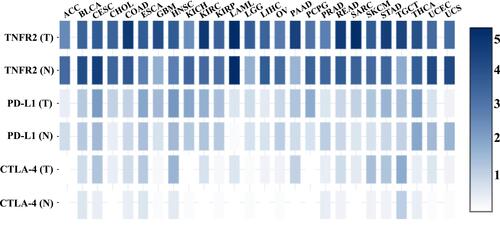
Figure 2 Comparison of TNFR2, PD-L1, CTLA-4 gene expression levels by human cancers and paired normal tissues. The transcriptomic analyses of indicated gene expression by human cancers and paired normal tissues were performed with GEPIA (Gene Expression Profiling Interactive Analysis) online database (http://gepia2.cancer-pku.cn/); is drawn according to specific data in the GEPIA database.Citation199 Log-scale was set to log 2 (TPM+1) in the analysis. The transcriptomic analyses were performed as described in Y-axis: transcript per million. X-axis: tumor (T, red) and paired normal tissues (N, grey). The number (num) of samples is indicated. The solid black line represents medium value. The box is the upper and lower quartiles and the two lines outside the box stand for the highest and lowest expression levels. Comparison between tumor and paired normal tissue: *p<0.01 (analyzed by one-way ANOVA).
Abbreviations: DLBC, lymphoid neoplasm diffuse large B-cell lymphoma; GBM, glioblastoma multiforme; HNSC, head and neck squamous cell carcinoma; KIRC, kidney renal clear cell carcinoma; LGG, brain lower grade glioma; N, normal; PAAD, pancreatic adenocarcinoma; SKCM, skin cutaneous melanoma; STAD, stomach adenocarcinoma; TGCT, testicular germ cell tumors; THYM, thymoma; T, tumor.
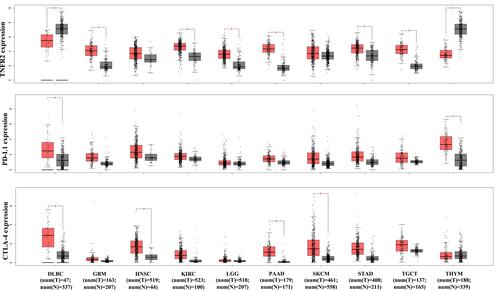
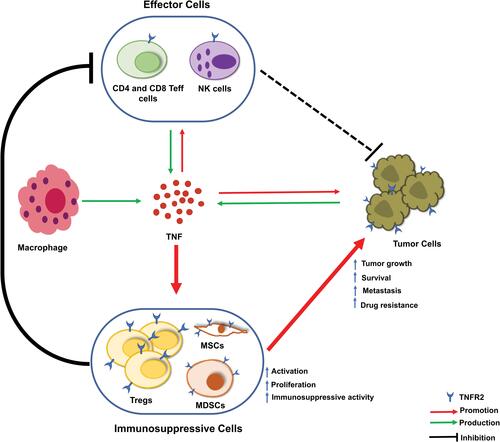
Figure 3 Current understanding of the role of TNF-TNFR2 signaling in the tumor microenvironment. In the tumor microenvironment (TME), tumor-associated macrophages, effector cells (CD4+ and CD8+ T effector (Teff) cells and natural killer (NK) cells), and tumor cells are the major source of TNF. In response to TNF stimulation, the number of CD4+Foxp3+TNFR2+ Treg cells are increased. These expanded Treg cells in TME are more stable in phenotype and more immunosuppressive. Moreover, TNF activates TNFR2+ myeloid-derived suppressor cells (MDSCs) and TNFR2+ mesenchymal stem cells (MSCs). Tregs, MDSCs, and MSCs likely operate collaboratively in the inhibition of the anti-tumor immune response and the promotion of tumor evasion. Further, TNFR2 signaling also promotes the survival, metastasis, and growth of the tumor.