Figures & data
Figure 1 Flowchart of our study.
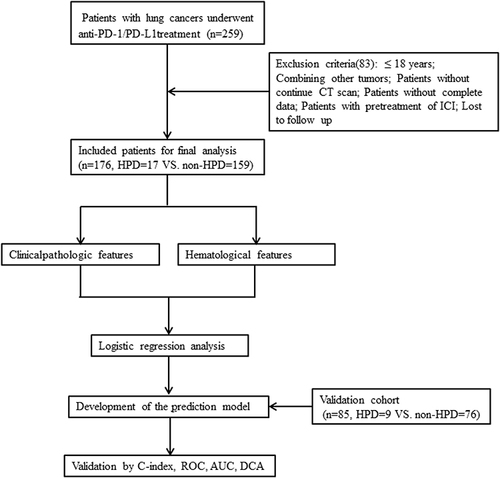
Table 1 Baseline Clinical Features of LC Patients with ICI Therapy
Table 2 Hematological Examination Biomarkers of LC Patients with ICI Therapy in the Primary Cohort
Table 3 Multivariate Logistic Regression Analysis Between Features and HPD in Advanced NSCLC
Figure 2 Kaplan–Meier survival curves in NSCLC patients according to HPD status, response categories and nomogram. (A) OS according to HPD. (B) PFS according to HPD. (C) OS according to response categories. (D) PFS according to response categories. (E) OS according to the nomogram. (F). PFS according to the nomogram. “HPD=0” indicates patients without HPD, while “HPD=1” indicates patients with HPD. “SD” indicates patients with stable disease, “PR” indicates patients with partial reaction, “PD” indicates patients with progressive disease but no HPD, and “HPD” indicates patients with hyperprogressive disease. “Low” indicates patients in the low-risk group according to the nomogram, while “High” indicates patients in the high-risk group according to the nomogram.
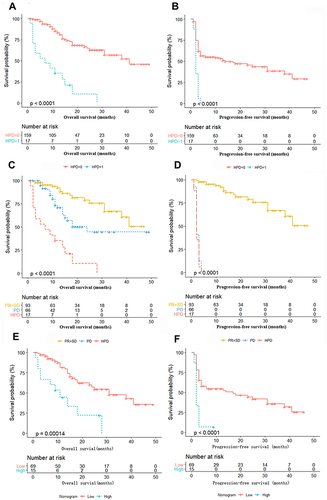
Figure 3 Pretherapy levels of APTT and Treg cells between HPD and non-HPD NSCLC patients. (A) The difference in serum levels of APTT in the primary cohort. (B) The difference in the levels of Treg cells in the primary cohort. (C) The difference in serum levels of APTT in the validation cohort. (D) The difference in the levels of Treg cells in the validation cohort.
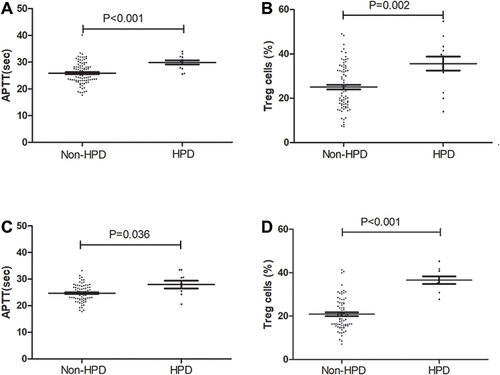
Figure 4 Kaplan–Meier survival curves in NSCLC patients according to the factors in the nomogram. (A) OS according to liver metastasis (P<0.05). (B) OS according to more than two metastatic sites (P>0.05). (C) OS according to APTT (P<0.05). (D) OS according to Treg cells (P<0.05).
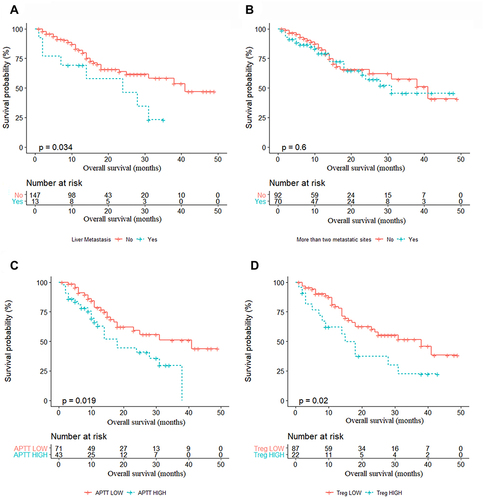
Figure 5 Development and validation of the prediction nomogram in the primary cohort. (A) Nomogram to predict HPD in patients with ICI therapy. The nomogram is valued to obtain the probability of HPD by adding up the points identified on the points scale for each variable, which included the presence of liver metastasis, more than two metastatic sites, APTT and Treg cells. Each patient has a different score due to different indicator points and is then divided into different risk groups. (B) Calibration curve of our nomogram. (C) The AUC of our nomogram was 0.845 (95% CI: 0.719–0.950, P<0.001). (D) The results of decision curve analysis. Decision curve analysis for the nomogram and other previously reported variables. The gray line represents the assumption that all patients have HPD. The thin black line represents the assumption that no patients have HPD.
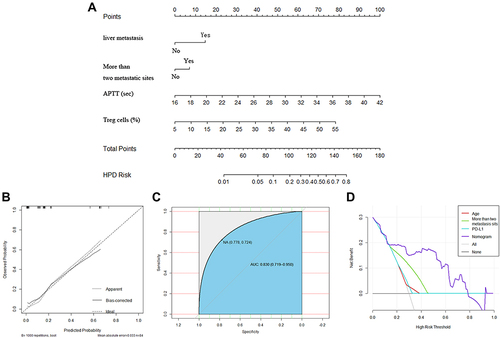
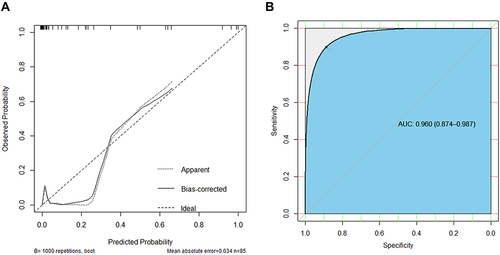
Figure 6 Discrimination of the nomogram was performed by using a concordance index (C-index) and ROC curve in the validation cohort. (A) Calibration curve of the nomogram in the validation cohort. (B) The AUC of our nomogram was 0.960 (95% CI: 0.874–0.987, P<0.001) in the validation cohort.