Figures & data
Figure 1 Selinexor synergizes with venetoclax to enhance apoptosis of AML cell lines in vitro. (A) Flow cytometric analysis of apoptosis in KG-1A and THP-1 cells. Cells were stained with annexin-V and 7-AAD. (B and C) Statistical differences were calculated on the basis of the total number of Annexin V+ cells for KG-1A cells (B) (treated with 250 nM selinexor, venetoclax or their combination) and THP-1 cells (C) (treated with 500 nM selinexor, venetoclax or their combination). (D and E) Determination of IC50 values for KG-1A (250 nm) (D) and THP-1 (950 nm) (E). The data are shown as the mean±SD. ***p< 0.001, ****p< 0.0001.
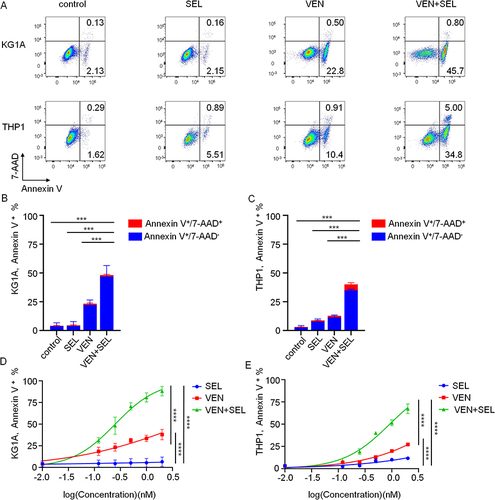
Figure 2 Selinexor synergizes with venetoclax to increase apoptosis of primary AML blasts. (A) In the flow gating strategy, primary AML cells were first gated by forward scattering (FSC) and side scattering (SSC), and then cells were stained for CD45, CD3 and CD33 simultaneously. (B and C) Apoptosis determination of primary cells of newly diagnosed AML (B) and R/R AML (C) treated with different concentrations of selinexor, venetoclax or their combination. (D and E) Statistical differences were calculated on the basis of the total number of Annexin V+ cells for primary cells of newly diagnosed AML (D) and R/R AML (E) (treated with 500 nM selinexor, venetoclax or their combination). The data are shown as the mean ± SD; *p< 0.05, **p< 0.01, ***p< 0.001, ****p< 0.0001.
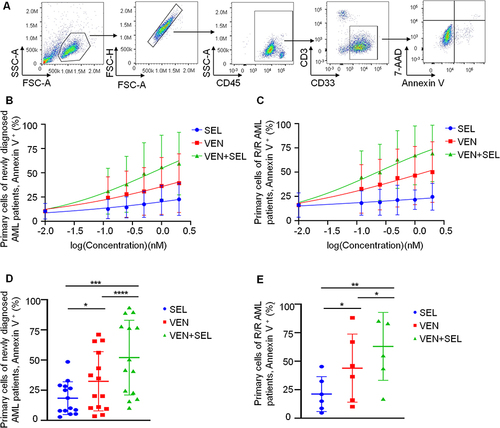
Figure 3 The venetoclax-selinexor combination decreases the glycolytic function of AML cell lines in vitro. (A and B) Representative Seahorse plots of the Glyco Stress Test of KG-1A (A) and THP-1 (B) cells (treated with IC50 concentrations of regimens) obtained by recording ECAR from five independent tests are shown. (C and D) The values of the indicated respiratory parameters were calculated from the Glyco Stress Test and are shown as the mean ± SD from five independent tests of KG-1A (C) and THP-1 (D) cells. (E-F) Representative Seahorse plots of the Mito Stress test of KG-1A (E) and THP-1 (F) cells (treated with IC50 concentrations of regimens) assessed by recording the OCR from five independent tests are shown. (G and H) The values of the indicated respiratory parameters were calculated from the XF Cell Mito Stress Test and are shown as the mean ± SD from five independent tests of KG-1A (G) and THP-1 (H) cells. Statistical analysis was performed using Student’s t test; **p < 0.01, ***p < 0.001, ****p< 0.0001.
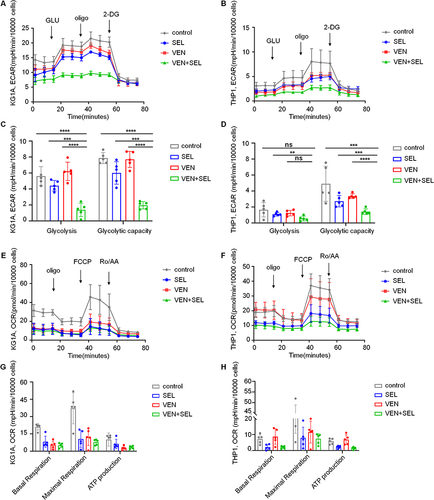
Figure 4 Flow cytometric analyses of NK cell cytotoxicity against pretreated AML cell lines. A scheme of NK cytotoxicity acquisition is shown in (A). The cytotoxicity of NK cells against KG-1A (B and C) and THP-1 (D and E) cells pretreated with selinexor, venetoclax or their combination was investigated. Compared to single-regimen pretreatment, venetoclax-selinexor combination pretreatment did not result in greater NK cell-mediated cytolysis of KG-1A and THP-1 cells.
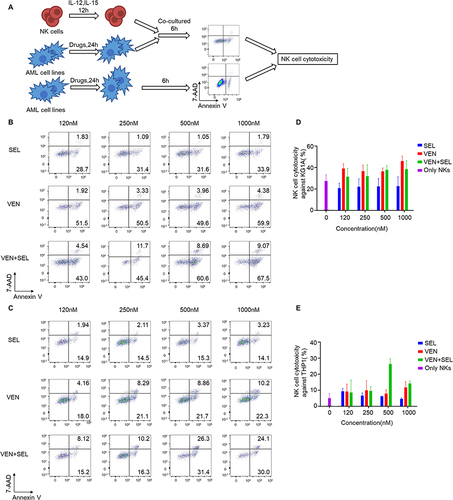
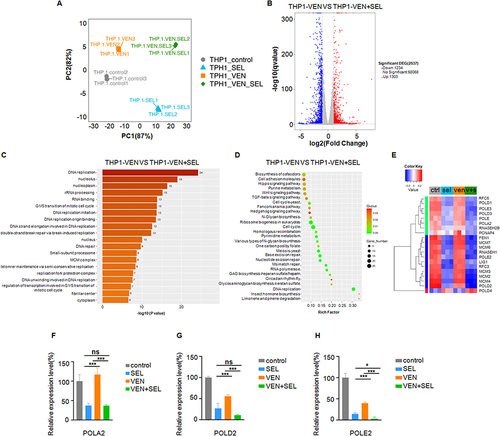
Figure 5 DNA replication-related genes are downregulated with venetoclax-selinexor combination treatment in THP-1 cells. (A) PCA plot of THP-1 cells in four groups treated without or with venetoclax (VEN), selinexor (SEL) or the venetoclax-selinexor (VEN+SEL) combination (control set, SEL set, VEN set and VEN+SEL set) (n=3). (B) Volcano plot of differentially expressed genes in THP-1 cells treated with VEN+SEL compared with those treated with VEN alone. (C) GO enrichment analysis of differentially expressed genes between the VEN set and the VEN+SEL set. (D) KEGG bubble plots showing enriched pathways of downregulated genes between the VEN set and the VEN+SEL set. (E) Heatmap visualizing the transcriptional response of the DNA replication pathway in KEGG of THP-1 cells treated with selinexor, venetoclax or the VEN+SEL combination. Experiments were performed in biological replicates (n=3). (F-H) Validation of downregulated genes using RT−qPCR. Statistical analysis was performed using Student’s t test; *p < 0.05, ***p < 0.001.