Figures & data
Table 1 Baseline Clinicopathologic Characteristics of NSCLC Patients in the FUSCC Cohort, TCGA Cohort, and Samstein et al Cohort
Figure 1 NSCLC patients harboring NOTCH1 mutations could benefit from ICB therapy. (A) Overall survival of NOTCH1-WT and -mutant NSCLC patients, who did not receive ICB therapy, was comparable in the TCGA dataset. (B) Overall survival of NOTCH1-mutant subset was significantly superior than that of NOTCH1-WT subset among NSCLC patients receiving ICB therapy in the Samstein et alCitation16 cohort. Dot lines indicate 95% confidence intervals.
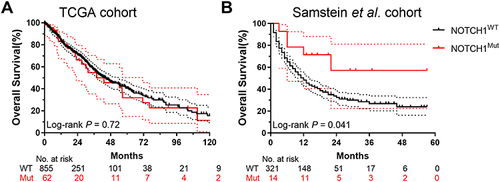
Table 2 Univariate and Multivariate Cox Regression Analysis of NSCLC Patients Receiving ICB Therapy in the Samstein et al Cohort
Figure 2 Impacts of NOTCH1 mutations on TMB and DNA damage repair-related gene signature. (A and B) The TMB of NOTCH1-mutant NSCLC was significantly higher than that of NOTCH1-WT tumors in the TCGA dataset (A) and Samstein et al cohort (B). (C–I) GESA plots showing signatures of PROCESSING OF DNA DOUBLE STRAND BREAK ENDS (C), DNA DOUBLE STRAND BREAK REPAIR (D), DNA DOUBLE STRAND BREAK RESPONSE (E), DNA REPAIR (F), DNA DAMAGE TELOMERE STRESS INDUCED SENESCENCE (G), G1/S DAN DAMAGE CHECKPOINTS (H), and G2/M DAN DAMAGE CHECKPOINTS (I). *p < 0.05 and ****p<0.0001.
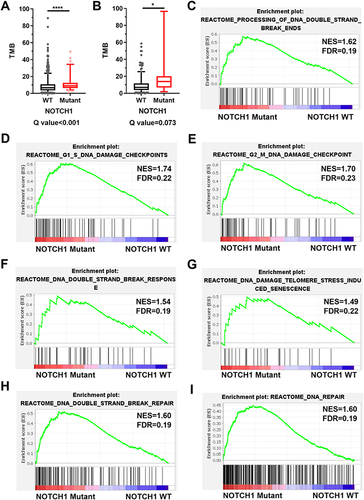
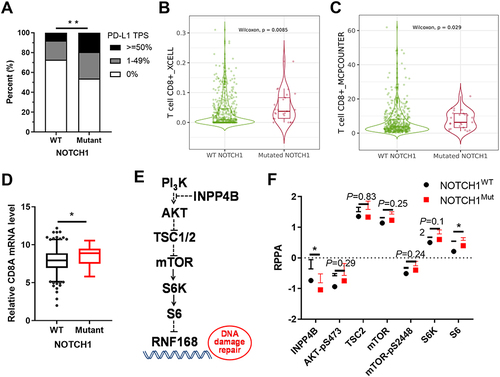
Figure 3 NOTCH1 mutations were associated with inflamed TME. (A) NOTCH1 mutations correlated with remarkably higher PD-L1 TPS in the FUSCC cohort. (B and C) NOTCH1 mutations were associated significantly higher CD8+ T cell by X-CELL (B) and by MCP-COUNTER (C). (D) The mRNA level of CD8A of NOTCH1-mutant NSCLC was significantly higher than that of NOTCH1-WT tumors in the TCGA dataset. (E) Schematic of PI3K-AKT-mTOR pathways that inhibit RNF168, result in suppression of DNA damage repair. (F) Analysis of protein levels by RPPA showed activation of AKT-mTOR signaling in NOTCH1-mutant NSCLC in the TCGA dataset. *p < 0.05 and **p<0.01.