
Figures & data
Figure 1 Flow chart of study design.
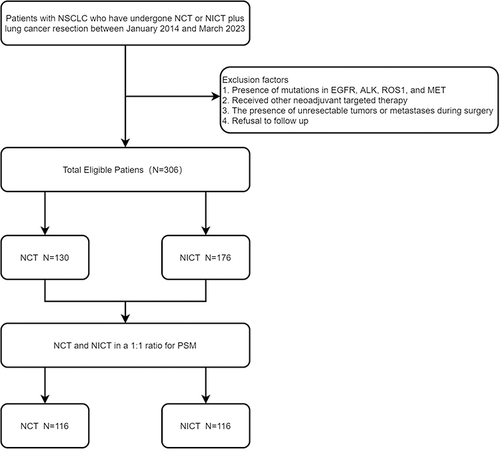
Table 1 Baseline Characteristics Before and After PSM and IPTW
Figure 2 Histogram for propensity scores.
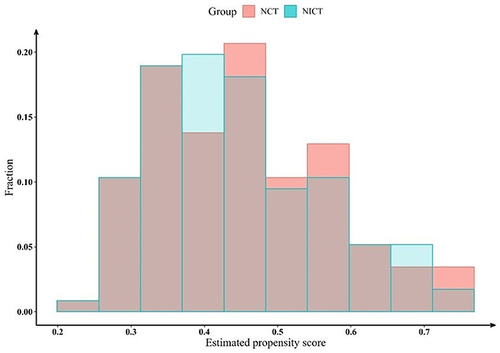
Table 2 Comparative Analysis of Pathological Outcomes Between NCT and NICT Before and After PSM and IPTW
Table 3 Comparative Analysis of Surgical Information Between NCT and NICT Before and After PSM and IPTW
Table 4 Failure Modes After Surgery
Figure 3 Kaplan-Meier survival analysis of DFS (A) and OS (B) between NCT and NICT before PSM; Kaplan-Meier survival analysis of DFS (C) and OS (D) between NCT and NICT after PSM.
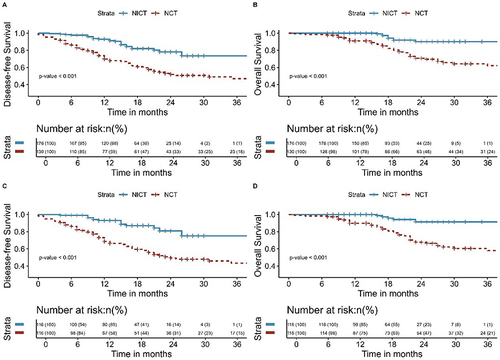
Figure 4 Kaplan-Meier survival analysis of DFS (A) and OS (B) between pCR and Non-pCR before PSM; Kaplan-Meier survival analysis of DFS (C) and OS (D) between pCR and Non-pCR after PSM.
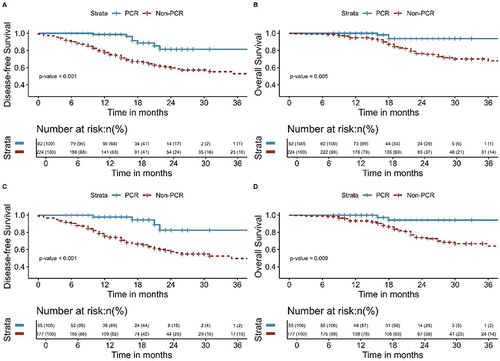
Figure 5 Kaplan-Meier survival analysis of DFS (A) and OS (B) between MPR and Non-MPR before PSM; Kaplan-Meier survival analysis of DFS (C) and OS (D) between MPR and Non-MPR after PSM.
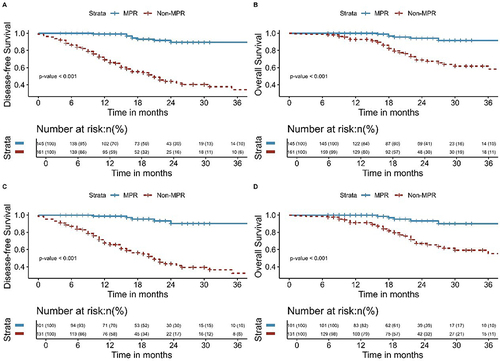
Figure 6 Kaplan-Meier survival analysis of DFS (A) and OS (B) between NCT and NICT before inverse probability of treatment weighting; Kaplan-Meier survival analysis of DFS (C) and OS (D) between NCT and NICT after inverse probability of treatment weighting.
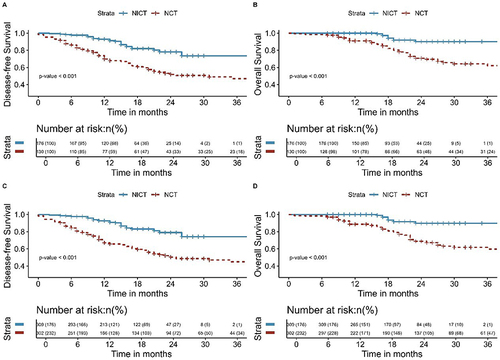
Figure 7 Kaplan-Meier survival analysis of DFS (A) and OS (B) between pCR and Non-pCR before inverse probability of treatment weighting; Kaplan-Meier survival analysis of DFS (C) and OS (D) between pCR and Non-pCR after inverse probability of treatment weighting.
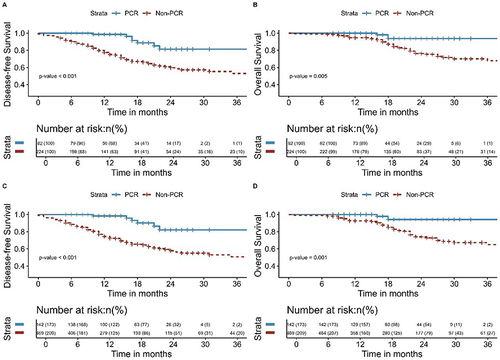
Figure 8 Kaplan-Meier survival analysis of DFS (A) and OS (B) between MPR and Non-MPR before inverse probability of treatment weighting; Kaplan-Meier survival analysis of DFS (C) and OS (D) between MPR and Non-MPR after inverse probability of treatment weighting.
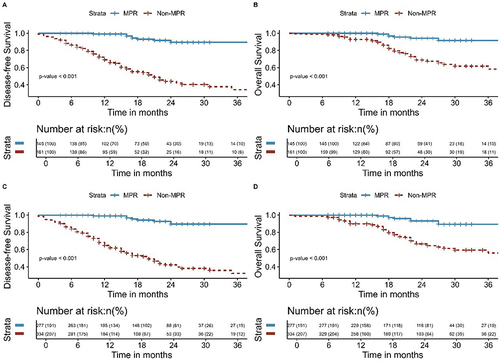
Table 5 Logistical Regression Analysis for Predictors of pCR
Table 6 Cox Regression Analysis for Predictors of OS and DFS