
Figures & data
Figure 1 Flow diagram of patient selection.
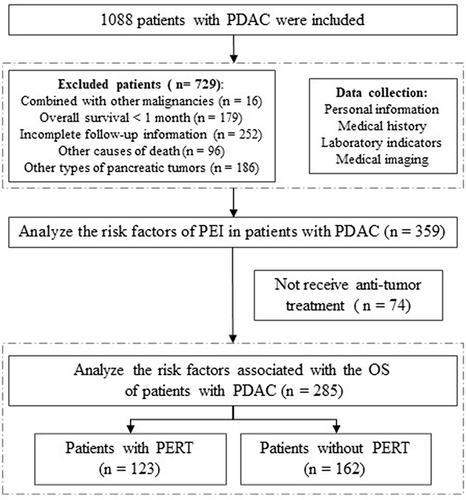
Table 1 Characteristics of Cohorts (n = 359)
Table 2 Clinical Characteristics of Patients with or Without PEI (n = 359)
Table 3 Logistic Regression Variables Analysis of Risk Factors for PEI in PDAC (n = 285)
Table 4 Characteristics of Cohorts (n = 285)
Table 5 Cox Proportional Hazard Regression Analysis of Risk Factors Associated with Overall Survival Among Patients with Pancreatic Cancer (n = 285)
Figure 2 Cox proportional hazards analysis evaluating the association between chemotherapy plus immunotherapy (ChIM) treatment and risk factors of patients with PDAC. Hazard ratio (HR) was expressed as ChIM-to-chemotherapy risk ratio.
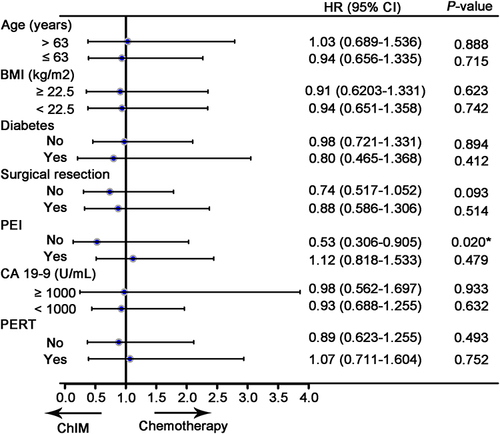
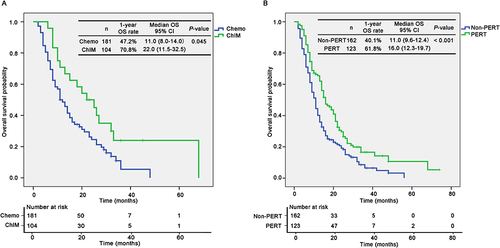
Figure 3 Kaplan–Meier survival analysis of patients with PDAC in different groups. (A) Kaplan–Meier curves of 1-year OS of patients receiving chemotherapy or ChIM. (B) Kaplan–Meier curves of 1-year OS of patients with or without PERT.
Data Sharing Statement
All the data in this study are available upon request from the corresponding author.