
Figures & data
Table 1 ICS pretreatment dose and ACQ at the start of baseline
Figure 1 Summary of all patients who were enrolled, randomized, completed and discontinued during the study.
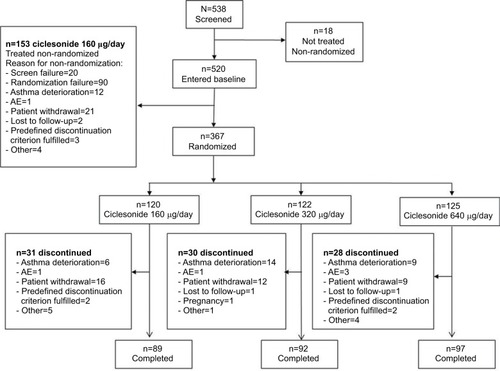
Table 2 Baseline demographics in the ITT population
Table 3 Change from baseline to last visit in ACQ score of within-treatment and between-treatment differences with three Cic doses
Table 4 LS mean change from baseline to last visit in ACQ score of between-treatment differences with Cic 640, 320 and 160 μg/day by exacerbation history subgroups (ITT)
Figure 2 Kaplan–Meier plot of time from randomization to well-controlled asthma in the ITT population.
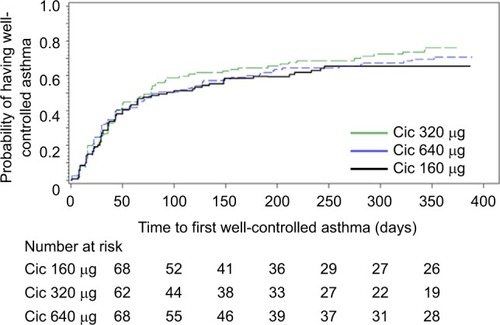
Table 5 Analysis of well-controlled asthma parameters over 52 weeks of treatment
Table 6 Post hoc sensitivity analyses for change from baseline to last visit in FEV1 of between-treatment differences in the ITT population
Table S1 Additional baseline demographics in the ITT population
Table S2 Concomitant use of short-acting beta 2-agonists in the ITT population
Table S3 Subgroup analyses of change from baseline to last visit in ACQ score of between-treatment differences with Cic 640 μg/day and Cic 160 μg/day (ITT)
Table S4 AEs occurring in at least 5% of patients in any treatment group