
Figures & data
Figure 1 (A) Seven lung sound recording positions; (B) lung sound analysis sonograms.
Notes: The upper panel represents an airflow curve. The portions below and above the horizontal central line represent the inhalation and exhalation air flows, respectively. The vertical axis represents frequency (in hertz), and the horizontal axis represents time (in seconds). The colors indicate different sound pressure levels (in decibels [dBSPL]).
Abbreviation: Ch, channel.
Abbreviation: Ch, channel.
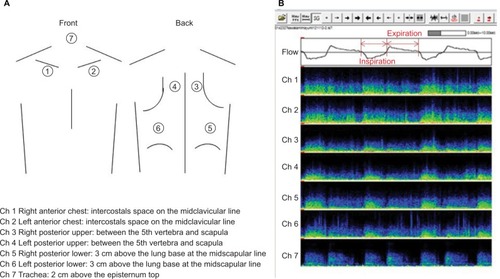
Table 1 Patient characteristics
Figure 2 E/I values in each frequency band in asthmatic subjects and healthy volunteers.
Notes: The vertical axis represents E/I values, and the horizontal axis denotes frequency bands (in hertz). The medians of E/I in individual frequency bands are plotted separately for patients with V50%pred <80%, asthmatic subjects with V50%pred ≥80%, and healthy volunteers.
Abbreviations: E/I, expiration-to-inspiration sound pressure ratio; %pred, %predicted; Ch, channel.
Abbreviations: E/I, expiration-to-inspiration sound pressure ratio; %pred, %predicted; Ch, channel.
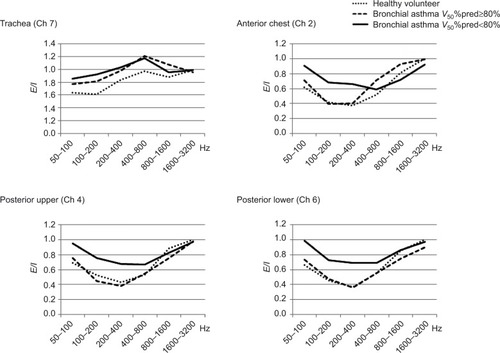
Table 2 Comparison of E/I values in each frequency band between asthmatic subjects and healthy volunteers
Table 3 Correlation of E/I, ESPL, and ISPL values with spirometry, PC20, and FeNO data in each frequency band (n=22)
Table 4 Differences in E/I MF among recording points in asthmatic subjects