Figures & data
Figure 1 Pulmonary function mechanics are improved in GC021109-treated mice.
Abbreviations: HDM, house dust mite; MCh, methacholine; SEM, standard error of means.
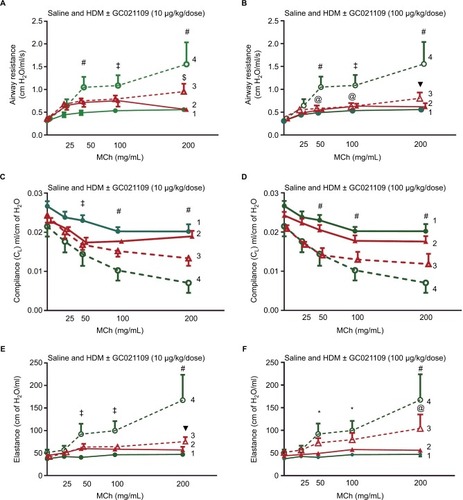
Figure 2 GC021109 prevents HDM-induced peribronchiolar and perivascular inflammatory cell infiltration.
Abbreviation: HDM, house dust mite.
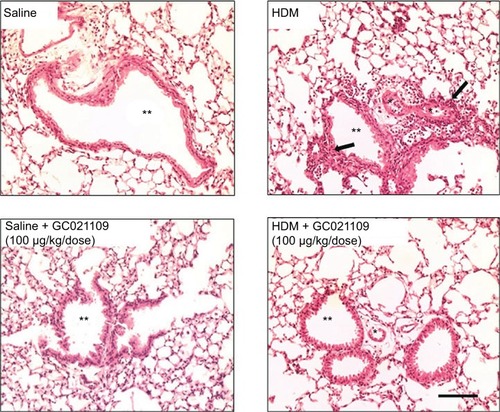
Figure 3 Increases in lung lavage content of inflammatory cells and protein after HDM exposure are normalized by the addition of GC021109.
Notes: (A) Total inflammatory cell numbers in lung lavage fluid from mice after exposure to saline (solid green), HDM (green striped), GC021109 (10 µg/kg weight/dose – solid red, 100 µg/kg weight/dose – solid black), and HDM + GC021109 (10 µg/kg weight/dose – striped red, 100 µg/kg weight/dose – striped black). Counts were performed using a hemocytometer. (B) Cumulative differential cell counts in lung lavage from saline-treated, HDM-treated, and HDM + GC021109 (100 µg/kg weight/dose)-treated mice. (C) Protein concentration in lung lavage fluid. Conditions were the same as in (A). Data represent mean ± SEM; N=5 mice per group. *P<0.01, compared to control; ^P<0.01, compared to HDM; ‡P<0.001, compared to HDM.
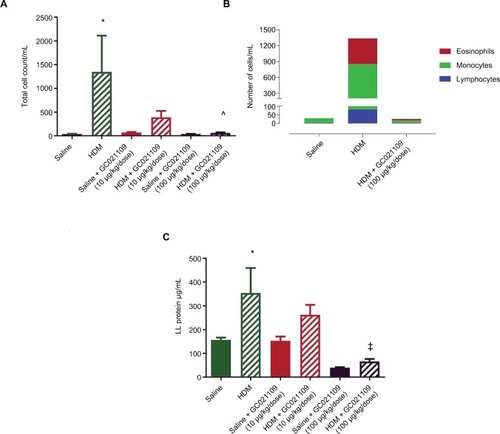
Figure 4 Asthma-related cytokines in lung lavage fluid are increased after HDM exposure but reduced by the addition of GC021109 in a dose-dependent pattern.
Abbreviations: HDM, house dust mite; SEM, standard error of means; IL, interleukin; G-CSF, granulocyte colony stimulating factor.
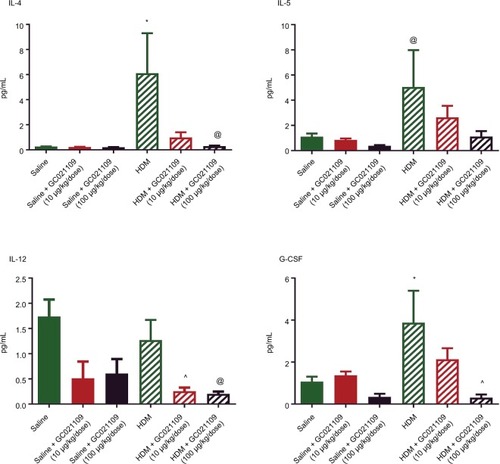
Figure 5 GC021109 reduces HDM-induced increases in peribronchial and perivascular α-SMA.
Notes: (A) Representative photomicrographs of α-SMA immunostaining in lungs from mice exposed to saline, GC021109 (10 and 100 µg/kg weight/dose), HDM, and HDM + GC021109 (10 and 100 µg/kg weight/dose). Arrows point to α-SMA immunostaining around bronchioles (orange) and blood vessels (blue). Increased α-SMA expression was observed in HDM-exposed lungs compared to controls but not in HDM + GC021109 (both doses). Bar =50 µm. (B) Quantification of the relative area of α-SMA immunopositivity around bronchioles and arteries, expressed as a percentage of the total area of the peri-luminal muscle layer. Area measurements were made using ImageJ (National Institutes of Health). HDM treatment significantly increased, and HDM + GC021109 (100 µg/kg weight/dose) prevented increase in α-SMA expression. Data represent mean ± SEM; N=4 lungs (3 measurements each). ‡P<0.0001, compared to control; ^P<0.005, compared to HDM.
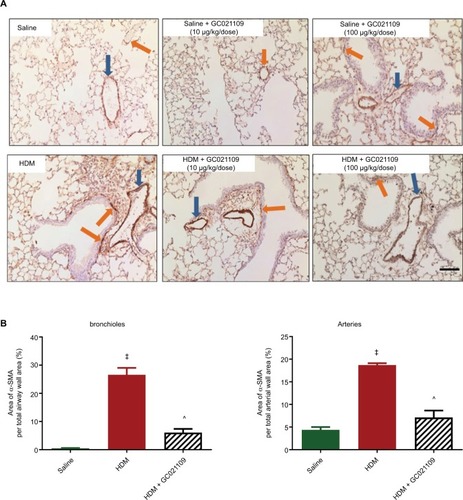
Figure 6 Peribronchial thickness identified by micro-CT scan is increased by HDM and ameliorated by HDM + GC021109.
Abbreviations: HDM, house dust mite; SEM, standard error of means; CT, computed tomography.
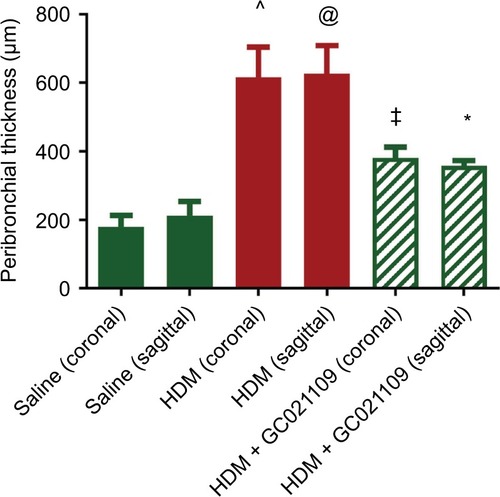
Figure S1 LLF fluid cell differential counts noted by a hemocytometer after Wright’s staining from mice treated with saline,
Notes: GC021109 (10 and 100 µg/kg weight/dose), HDM, or HDM + GC021109 (10 and 100 µg/kg weight/dose). Black bars: lymphocytes; green bars: macrophages; red bars: eosinophils. Data are expressed as % total white blood cells counted, and shown as mean ± SEM; N=5 mice.
Abbreviations: HDM, house dust mite; SEM, standard error of means; LLF, lung lavage fluid.
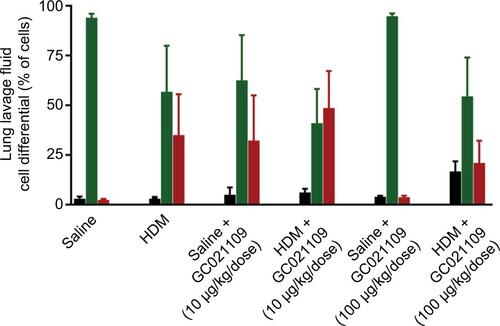
Figure S2 Additional selected cytokines significantly increased in LLF fluid by HDM and normalized by the addition of GC021109.
Notes: These results are from the same animals and were obtained in the multiplex assay explained in the legend of . They are shown as supplementary data as cytokines of interest in allergen-induced asthma that were markedly increased by HDM sensitization but the response to added GC021109 with HDM sensitization did not demonstrate a clear dose–response relationship. Nonetheless, these data do illustrate the tendency of added GC021109 to profoundly reduce the levels of specific cytokines in HDM mice. Specific treatment conditions are labeled along the X axis. The Y axis represents picograms/mL of IL-6, IL-17, LIF, and CXCL1, respectively. Data represent mean ± SEM; N=3–9; *P<0.05, compared to the saline controls; ▼P<0.01, compared to saline controls; ‡P<0.005, compared to saline controls; @P<0.10, compared to HDM: ^P<0.05, compared to HDM. The HDM + GC021109 condition in the IL-6 panel had very low identical measurements; thus, no standard error or statistical test results are shown.
Abbreviations: HDM, house dust mite; SEM, standard error of means; LLF, lung lavage fluid; IL, interleukin; LIF, leukemia inhibitory factor; CXCL1, chemokine (C-X-C) motif ligand 1.
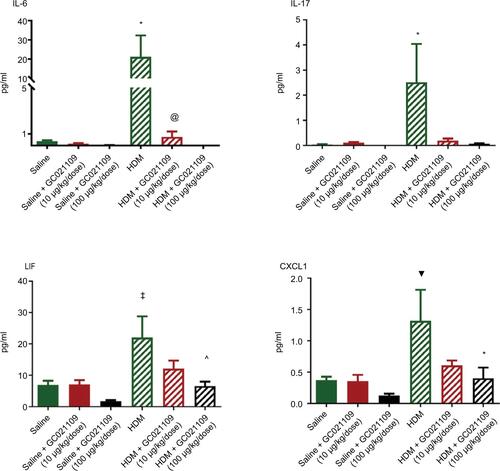
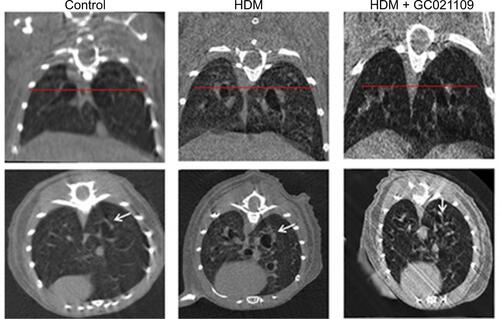
Figure S3 Representative micro-CT images of mice from the control, HDM, and HDM + GC021109 treatment groups.
Notes: Coronal (top) and transverse axis (bottom) images are shown for each condition. The horizontal line in the coronal images represents the level at which the corresponding transverse axis images were viewed and is the level of the third-generation bronchi. Arrows point to peribronchial airway thickness in third-generation airways.
Abbreviations: HDM, house dust mite; CT, computed tomography.