Figures & data
Figure 1 Study design.
Abbreviations: CPRD, Clinical Practice Research Datalink; GP, general practitioner; OCS, oral corticosteroid; OPCRD, Optimum Patient Care Research Database; SCS, systemic corticosteroid.
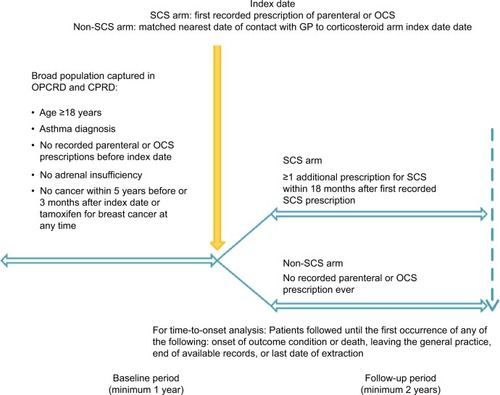
Table 1 Outcomes evaluated after the index date in each risk cohort
Table 2 Baseline characteristics of the matched treatment arms
Table 3 Incidence of outcomes of interest in the matched non-SCS and SCS arms
Figure 2 HR (95% CI) for each adverse outcome in the SCS arms (vs non-SCS arms). The open squares represent unadjusted, and the closed squares, adjusted results. The adjusted HRs (95% CIs) are shown on the right. See Table S3 for list of confounders.
Abbreviations: BMI, body mass index; SCS, systemic corticosteroid.
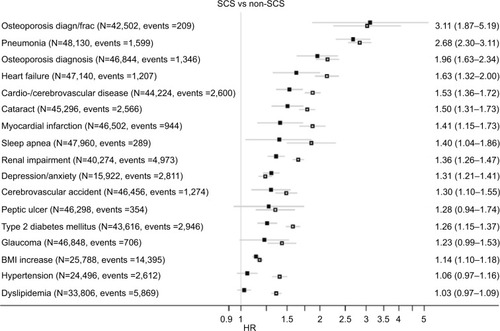
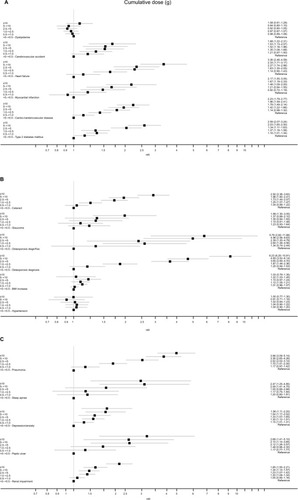
Figure 3 (A–C) Adjusted hazard ratio (95% CI) for each adverse outcome in the SCS arms for categorized, cumulative SCS exposures, compared with the reference category of >0 to <0.5-g cumulative exposure. See Table S3 for list of confounders.
Abbreviations: BMI, body mass index; SCS, systemic corticosteroid.