Figures & data
Figure 1 Asthma phenotypes, based on cluster analysis.
Notes: Reprinted with permission of the American Thoracic Society. Copyright© 2018 American Thoracic Society. Haldar P, Pavord ID, Shaw DE, Berry MA, Thomas M, Brightling CE, Wardlaw AJ, Green RH. Cluster analysis and clinical asthma phenotypes. Am J Respir Crit Care Med. 2008;178(3):218–24.Citation7 The American Journal of Respiratory and Critical Care Medicine is an official journal of the American Thoracic Society.
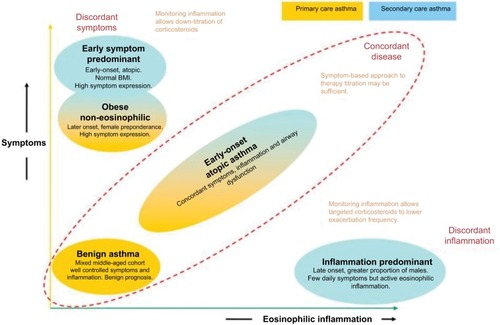
Figure 2 Cohort timeline.
Abbreviations: BMI, body mass index; UTS, up-to-standard.
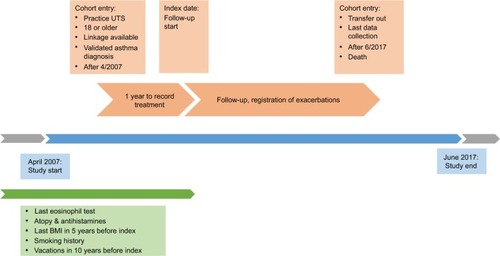
Figure 3 Flowchart of study eligibility and participation.
Abbreviations: BMI, body mass index; CPRD, Clinical Practice Research Datalink; HES, Hospital Episode Statistics; A&E, accidents and emergencies; ONS, Office for National Statistics; NOS, not otherwise specified.
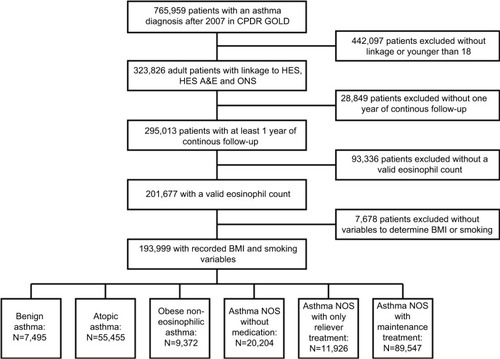
Table 1 Baseline characteristics of the study population by phenotype
Figure 4 BTS step by phenotype.
Abbreviations: BTS, British Thoracic Society; eos, eosinophilic; NOS, not otherwise specified; SABA, short-acting beta agonist; Tx, treatment.
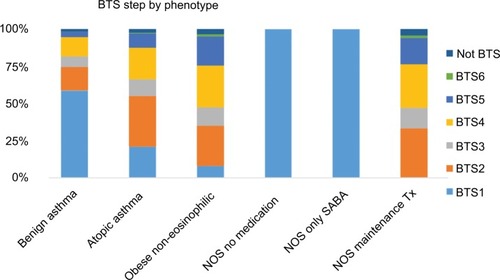
Table 2 Exacerbation rates by phenotype
Figure 5 IRRs, stratified by treatment step.
Notes: Adjustment for step 6 resulted in very wide CIs due to low sample size. This made the forest plot unreadable, so this adjustment is not displayed.
Abbreviations: BTS, British Thoracic Society; IRR, incidence rate ratio; med; medication; NOS, not otherwise specified.
Abbreviations: BTS, British Thoracic Society; IRR, incidence rate ratio; med; medication; NOS, not otherwise specified.
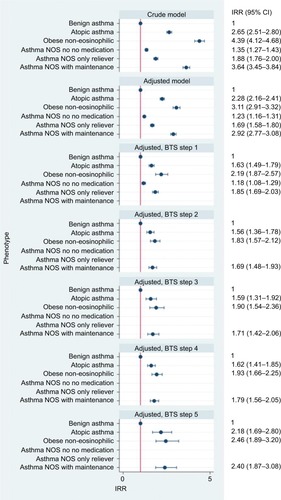
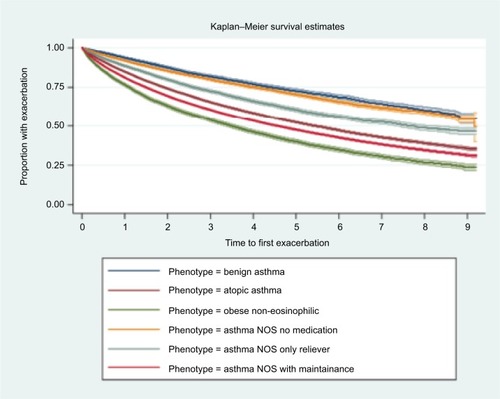
Figure 6 Time to first exacerbation analysis in years, by phenotype and 95% confidence intervals.
Abbreviation: NOS, not otherwise specified.