
Figures & data
Table 1 Candidate genes and their associated SNPs
Table 2 Demographic and clinical data of the participants
Table 3 MAFs and HWE of the included genetic markers
Table 4 Genotypic distributions and allelic associations of the studied SNPs with asthma control
Figure 1 Genetic haplotype blocks: linkage disequilibrium plot of genotyped polymorphisms in CRHR1 (block 1) and ADRB2 (block 2). Boxes without numbers have D′=1.
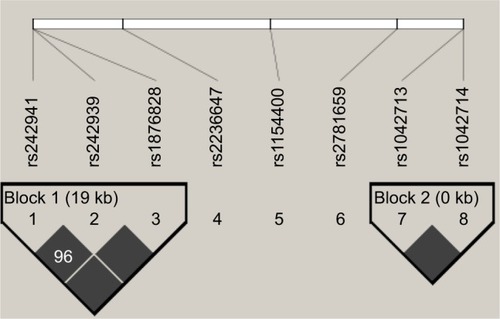
Table 5 Association between the formed haplotypes and uncontrolled asthma