
Figures & data
Figure 1 Regression for Xrs5 within two height ranges. Comparison between the models which takes into account the whole sample (height range = 0.9 m–1.16 m; n=96; dotted line) and the model that takes into account individuals of height less than 1.07m (Size range = 0.9m-1.07m; n=69; continuous line), inflection point of the slope of the model with all individuals (vertical line). The graph shows the effect of reduction in slope of regression when contemplating (N=30), generating a deviation of the trend of the height group smaller than 1.07 m (n=69). Blue triangles correspond to men and red squares women.
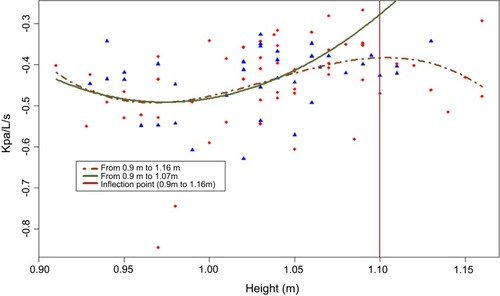
Figure 2 Selection for the impulse oscillometry test.
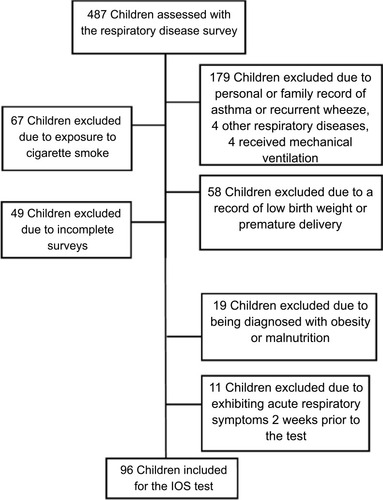
Table 1 Anthropometric data from the participants
Figure 3 Representation of the linear regression analysis of the measures Rrs5 and Xrs5. A positive relation is observed with an increase of Xrs5 as the size increases and a negative linear relation, with decrease of Rrs5.
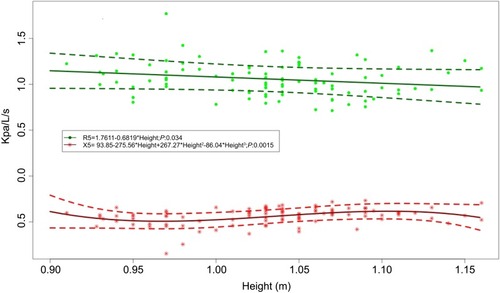
Table 2 Impulse oscillometry parameters at baseline and bronchodilator responses
Table 3 Reference equations for impulse oscillometry variables in healthy children
Figure 4 Comparison of reference equations for respiratory resistance at 5Hz between this study and previous studies in young healthy children.
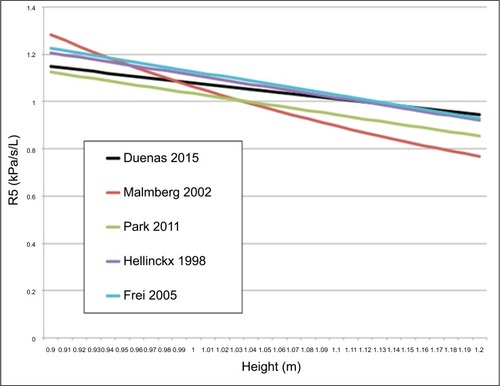
Table 4 Summary of equations of regression for Rrs5 in healthy children