
Figures & data
Table 1 Patient Characteristics And E/I MF Value When Classified Into 4 Groups By Combination Of FEV1 And FeNO
Figure 1 Comparison of E/I MF values in four groups classified by combinations of FEV1 and FeNO. FEV1; abnormal (A) cases were defined as FEV1/FVC < 70% or FEV1, %predicted < 80%. Normal (N) cases were defined as FEV1/FVC ≥ 70% and FEV1, %predicted ≥ 80%. FeNO; abnormal (A) cases were defined as FeNO ≥ 38 ppb, whereas normal (N) cases were defined as FeNO < 38 ppb. *p < 0.05, **p < 0. 01.
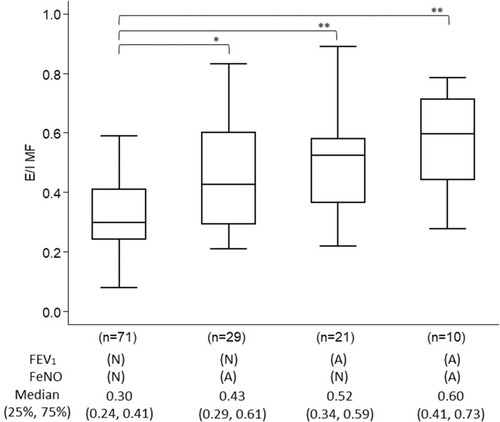
Table 2 Correlation Between E/I MF And Respiratory Function, FeNO, Sputum Eosinophils
Table 3 Factors Involved In FeNO In FEV1 Normal Groups (group NN And NA) By Multivariate Analysis