
Figures & data
Figure 1 Study population flowchart.
Abbreviations: (C-) ACT, (Child) Asthma Control Test; EP, electronic portal; n, number.
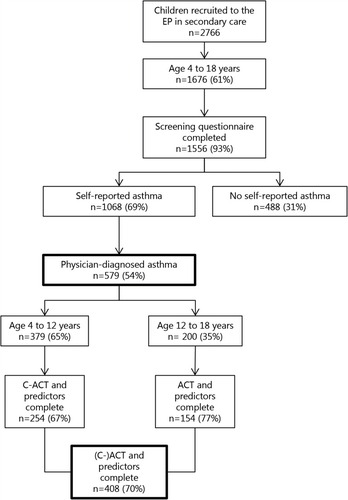
Figure 2 Venn diagrams displaying the proportion of atopic comorbidities among children with asthma stratified by referral reason (A and B). Data are n (%).
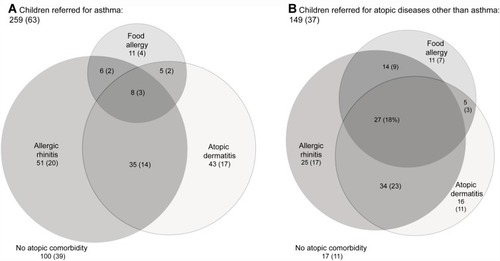
Table 1 Clinical Characteristics of Children with Asthma
Table 2 Univariable and Fitted Multivariable Logistic Regression Analysis with Uncontrolled Asthma (ACT Score <20) as the Outcome
Availability of Data and Material
The datasets generated and/or analyzed during the current study are not publicly available due to privacy or ethical restrictions but are available from the corresponding author on reasonable request.