
Figures & data
Table 1 Subject Characteristics and Baseline Biomarker Concentration in Plasma
Figure 1 Relative change in plasma levels of IL-13 (A), TARC (B), periostin (C) and Cys-LT (D) before (pre) and 10, 30 and 60 min after an exercise challenge test in controls and asthmatics. Medians and interquartiles are presented. ***=significant change over all time points in all subjects with p<0.001 according to Friedman test.
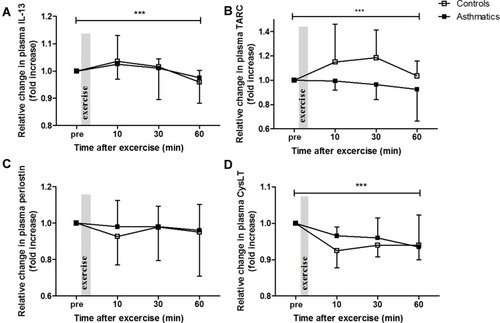
Figure 2 Urinary levels of IL-13 (A) and LTE4 (B) before (pre) and 30 and 60 min after an exercise challenge test in controls and asthmatics. Medians and interquartiles are presented and significant changes in all subjects are shown as **=p<0.01 and ***=p<0.001 according to Wilcoxon signed-rank test.

Table 2 Correlations Between Baseline Values of the Respective Biomarkers in Plasma or Urine