Figures & data
Table 1 Primers Used for Semi-Quantitative RT-PCR
Figure 1 mRNA expression of VDR (A) and CYP24A1 (B) in NHBFCs or DHBFCs as a response to 1,25(OH)2D3 (50 nM or 100 nM) treatment. Student t-test was applied to compare the fold change difference in mRNA expression between two experimental conditions and associated p- values are indicated. (ns) p > 0.05, no significant difference in mean fold change mRNA expression. Data were expressed as mean ± standard error (SE) from duplicate values of two independent experiments. NHBFCs (n=4), DHBFCs (n=4).
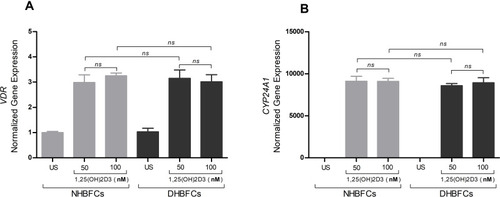
Figure 2 mRNA expression of TGF-β1 or TNF-α-IL-1β-induced fibrogenic markers/CCL-chemokines in NHBFCs or DHBFCs in response to 1,25(OH)2D3 (50 nM) treatment: FN 1 (A), LUM (B), BGN (C), COL5A1 (D), MMP2 (E), TIMP1 (F), CCL2 (G), CCL5 (H) and CCL11 (I). The Student’s t-test (variances assumed equally by ANOVA) was used to determine the difference between NHBFCs and DHBFCs under a given treatment and associated p- values are indicated. (ns) p > 0.05, no significant difference in mean fold change mRNA expression. Data were expressed as mean ± standard error (SE) from duplicate values of two independent experiments. NHBFCs (n=4), DHBFCs (n=4).
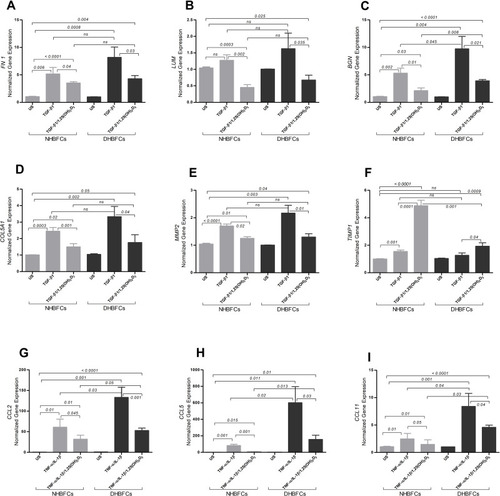
Table 2 The mRNA Expression and Protein Level of Fibrogenic Markers and CC-Chemokines, Intra-and Inter-Groups’ Comparisons
Figure 3 Protein levels of TGF-β1 or TNF-α-IL-1β-induced fibrogenic markers/CCL-chemokines in NHBFCs or DHBFCs in response to 1,25(OH)2D3 (50 nM): fibronectin 1 (A), lumican (B), MCP1 (C), RANTES (D) and eotaxin-1 (E). The Student’s t-test (variances assumed equally by ANOVA) was used to determine the difference between NHBFCs and DHBFCs under a given treatment and associated p- values are indicated. (ns) p > 0.05, no significant difference. Data were expressed as mean ± standard error (SE) from duplicate values of two independent experiments. NHBFCs (n=4), DHBFCs (n=4).
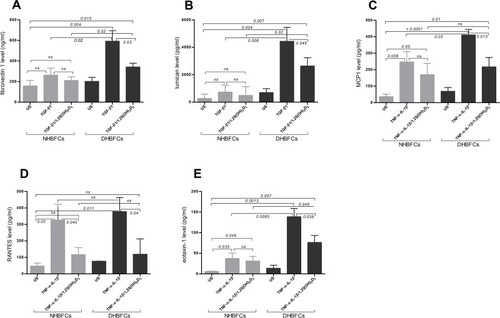
Figure 4 Effect of 1,25(OH)2D3 (50 nM) on HBFCs proliferation using flow cytometry (A–G). HBFCs have been measured for 7AAD or BrdU content and were assigned to the G0/G1, S or G2/M phases by drawing gates, as demonstrated in each panel: TGF-β1-treated NHBFCs (A), 1,25(OH)2D3-TGF-β1-treated NHBFCs (B), TGF-β1-treated NHBFCs vs 1,25(OH)2D3-TGF-β1-treated NHBFCs, overlapped data (C), TGF-β1-treated DHBFCs (D), 1,25(OH)2D3-TGF-β1-treated DHBFCs (E), TGF-β1-treated DHBFCs vs 1,25(OH)2D3-TGF-β1-treated DHBFCs, overlapped data (F). The percentage of cells in each gate represents the relative number of NHBFCs or DHBFCs in G0/G1, S, and G2/M. (G) Graphic quantitation of the respective cell cycle phases using GraphPad. (H) mRNA expression of CCND1 in TGF-β1-induced-DHBFCs or NHBFCs in response to 1,25(OH)2D3 (50 nM) treatment. The Student’s t-test (variances assumed equally by ANOVA) was used to determine the difference between NHBFCs and DHBFCs under a given treatment and associated p- values are indicated. (ns) p > 0.05, no significant difference. Data were expressed as mean ± standard error (SE) from duplicate values of two independent experiments. NHBFCs (n=4), DHBFCs (n=4).
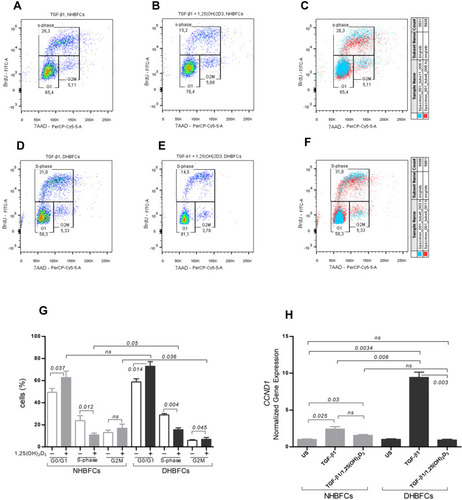
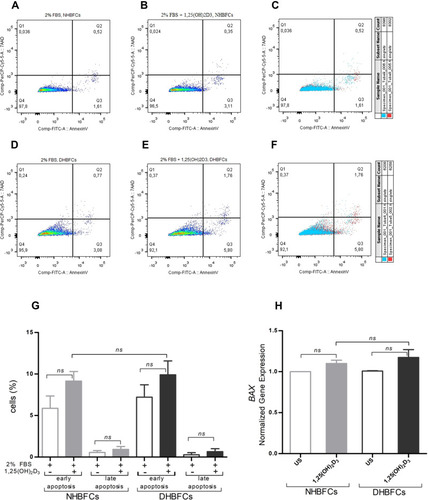
Figure 5 Effect of 1,25(OH)2D3 (50 nM) on HBFCs apoptosis using flow cytometry (A–G). HBFCs have been measured for Annexin V-FITC or 7AAD content and assigned to different cell populations by drawing gates, as demonstrated in each panel: Q1 (necrotic cells), Q2 (late apoptotic cells), Q3 (early apoptotic cells) and Q4 (living intact cells). TGF-β1-treated NHBFCs (A), 1,25(OH)2D3-TGF-β1-treated NHBFCs (B), TGF-β1-treated NHBFCs vs 1,25(OH)2D3-TGF-β1-treated NHBFCs, overlapped data (C), TGF-β1-treated DHBFCs (D), 1,25(OH)2D3-TGF-β1-treated DHBFCs (E), TGF-β1-treated DHBFCs vs 1,25(OH)2D3-TGF-β1-treated DHBFCs, overlapped data (F). The population percentage in each quadrant is also indicated. (G) Graphic quantitation of the respective cell populations using GraphPad. (H) mRNA expression of BAX in 1,25(OH)2D3 (50 nM) treated HBFCs. The Student’s t-test (variances assumed equally by ANOVA) was used to determine the difference between NHBFCs and DHBFCs under a given treatment and associated p- values are indicated. (ns) p > 0.05, no significant difference. Data were expressed as mean ± standard error (SE) from duplicate values of two independent experiments. NHBFCs (n=4), DHBFCs (n=4).