Figures & data
Figure 1 Flow chart of the study recruitment process.
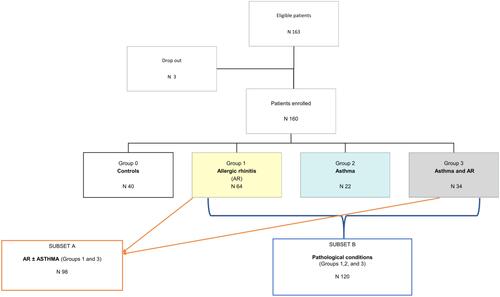
Table 1 Characteristics of the Study Participants, Evaluation of Respiratory NO Metabolites and Rhinomanometric/Spirometric Values Within All Groups, Subset A and B
Table 2 Post Hoc Analysis of nFeNO, mNF, eFeNO, and FEV1 between Groups
Figure 2 Boxplots of the distribution of the variables between groups. Boxplots representing the distribution of the variables nFeNO (A), eFeNO (B), FEV1 (C), mNF (D) and nFeNO/eFeNO (E) among the four groups of the population: white (group 1, ie controls), light yellow (group 2, ie allergic rhinitis), light blue (group 3, ie asthma) and grey (group 3, ie allergic rhinitis and asthma). All the p values were <0.0001 for each variables between groups using Kruskal-Wallis rank-sum test (A–E). See also the post hoc analysis tables for each couple of the comparisons.
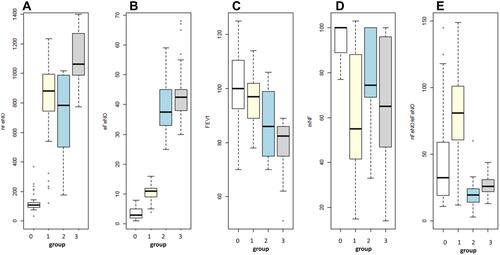
Figure 3 ROC curves of nFeNO for subset A. ROC curves of nFeNO as a predictor for allergic rhinitis alone or with asthma (subset A) without the covariate sex (A). Next, two analogue sex-adjusted curves, respectively, for males (B) and females (C). All the graphs report the cut-off values of nFeNO, specificity (Sp) and sensitivity (Se) levels with also the area under curve (AUC) values and its 95% confidence interval (CI). Below each figure, there is the relative summary: AUC, AUC CI 95%, Se and Sp.
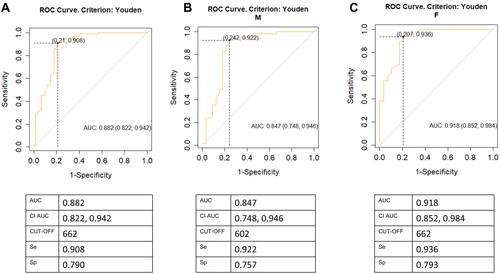
Figure 4 ROC curves of nFeNO for group 3. ROC curves of nFeNO as a predictor for asthma and allergic rhinitis (group 3) without the covariate sex (A). Next, two analogue sex-adjusted curves, respectively, for males (B) and females (C). All the graphs report the cut off values of nFeNO, specificity (Sp) and sensitivity (Se) levels with also the area under curve (AUC) values and its 95% confidence interval (CI). Below each figure, there is the relative summary: AUC, AUC CI 95%, Se and Sp.
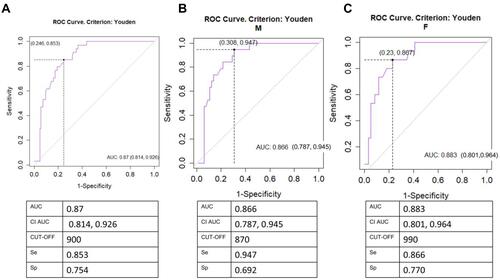
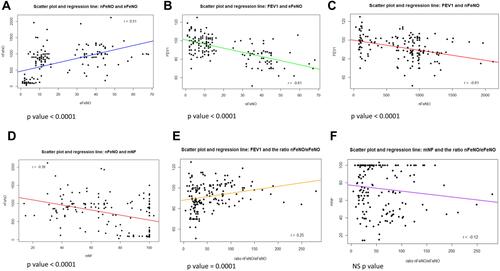
Figure 5 Scatter plots and Pearson’s correlation among nFeNO, mNF, eFeNO, FEV1 and the ratio nFeNO/eFeNO. The scatter plots with the regression line and Pearson’s correlation coefficient of the linear correlation: positive correlation (r= - 0.51) between nFeNO with eFeNO (A), negative correlation (r=- 0.61) between FEV1 with eFeNO (B), negative correlation (r= - 0.61) between FEV1 and nFeNO (C), negative correlation (r =- 0.39) between nFeNO and mNF (D), positive correlation (r=0.25) between FEV1 and the ratio nFeNO/eFeNO (E), and the negative correlation (r=−0.12) between mNF and the ratio nFeNO/eFeNO (F).