Figures & data
Figure 1 PRISMA 2020 flow diagram for the identification of Phase III RCTs included in the meta-analysis concerning the safety profile of triple FDC in asthma.
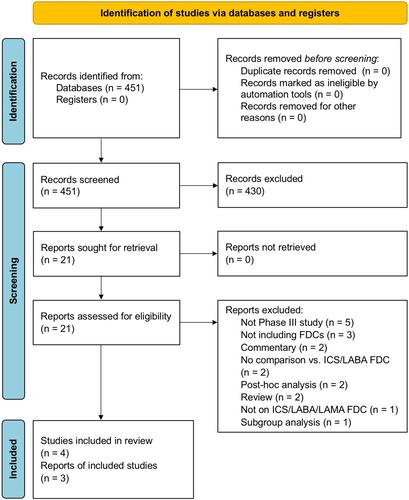
Table 1 Level of ICS Doses in Agreement with the Daily Doses of Medications in Adults in the Phase III RCTs Included in the Meta-Analysis as Reported by Current GINA RecommendationsCitation10 and NICE Guidelines.Citation11
Figure 2 Forest plot of meta-analysis concerning the impact of triple FDC vs ICS/LABA FDC on the risk of total SAEs. The effect estimates resulting from the meta-analysis are reported in bold.
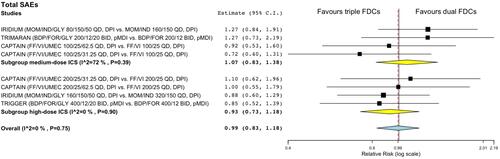
Figure 3 Forest plots of meta-analysis concerning the impact of triple FDC vs ICS/LABA FDC on the risk of cardiac SAEs (A) and vascular SAEs (B). (B’) reports the overall sensitivity meta-analysis by excluding the comparison (FF/VI/UMEC 200/25/31.25 vs FF/VI 200/25) that introduced substantial heterogeneity in the subgroup high-dose ICS. The effect estimates resulting from the meta-analysis are reported in bold.
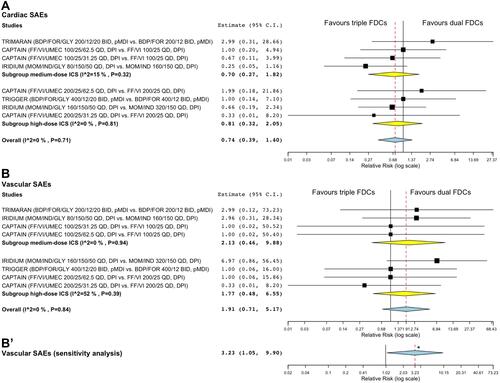
Figure 4 Forest plots of meta-analysis concerning the impact of triple FDC vs ICS/LABA FDC on the risk of pneumonia reported as SAE. The effect estimates resulting from the meta-analysis are reported in bold.
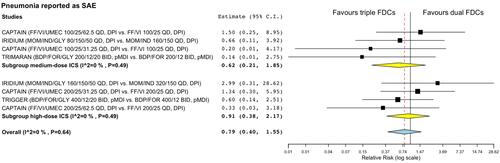
Table 2 Pooled Analysis of Total SAEs, Cardiovascular SAEs, and Pneumonia with Number of Events, Frequency, and Rank According to EMA Guidelines.Citation14
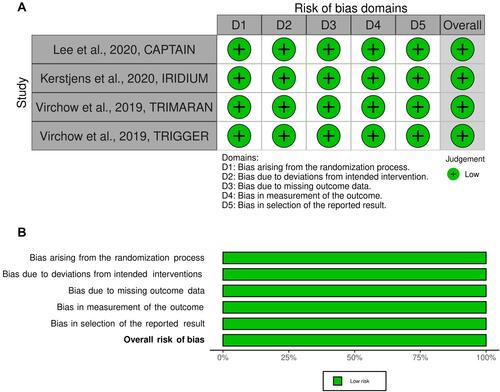
Figure 5 Traffic light plot for assessment of the risk of bias of each included Phase III RCT (A) and weighted plot for the assessment of the overall risk of bias (B) via the Cochrane RoB 2 tool (n=4 Phase III RCTs). The overall risk of bias resulting from the Cochrane RoB 2 tool is reported in bold.