Figures & data
Figure 1 AAER during each season.
Note: Data are annualized rates and 95% CIs.
Abbreviations: AAER, annualized asthma exacerbation rate; CI, confidence interval; Q4W, every 4 weeks.
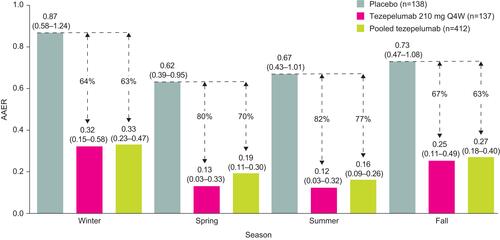
Figure 2 Mean number of days with an asthma exacerbation per patient, by season.
Notes: Standard deviations are provided in parentheses. Winter, spring, summer and fall are defined as Jan–Mar, Apr–Jun, Jul–Sep and Oct–Dec, respectively.
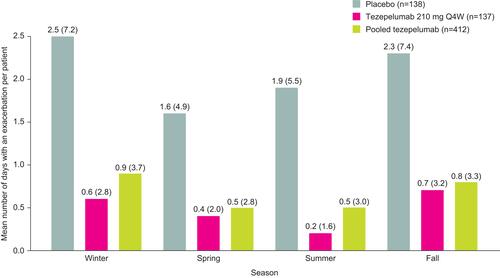
Figure 3 Mean number of days with an asthma exacerbation per patient, for each week of the year.
Notes: Weeks are defined as 7-day periods starting on January 1; day 365 was added to week 52, resulting in an 8-day week.
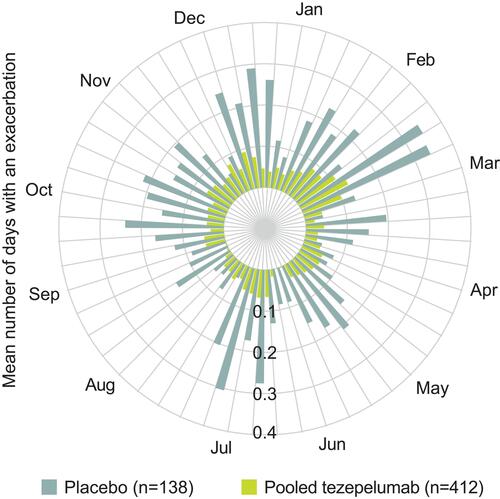
Table 1 Number of Patients with Asthma Exacerbations by Season
Figure 4 Proportion of patients with asthma exacerbations per day throughout the year.
Notes: The upper part of the figure shows the marginal overlapping area plot of exacerbations per day throughout the year, expressed as percentage of placebo patients and percentage of all tezepelumab treatment arms summed. The lower part of the figure shows the occurrence and duration of individual exacerbations. Treatment arms are grouped between horizontal dividers.
Abbreviations: Q2W, every 2 weeks; Q4W, every 4 weeks.
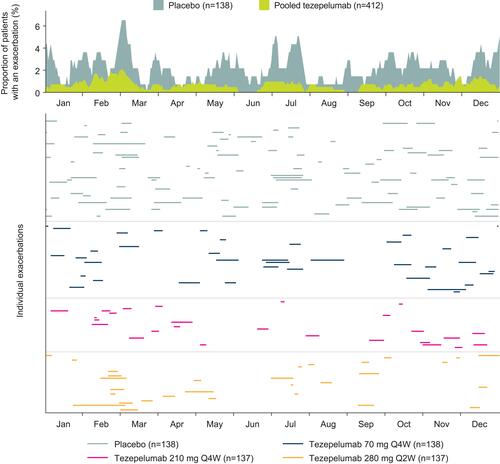
Figure 5 Proportion of patients with asthma exacerbations per day throughout the year, stratified by (A) low (<300 cells/µL; left) or high (≥300 cells/µL; right) baseline blood eosinophil counts, or (B) atopic (FEIA+; left) or non-atopic (FEIA−; right) asthma status.
Notes: A number of patients had no atopic status recorded (placebo, n=8; pooled tezepelumab, n=28).
Abbreviations: FEIA, fluoro-enzyme immunoassay; Q4W, every 4 weeks.
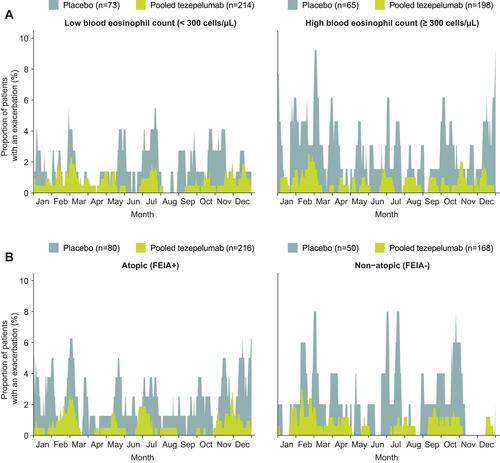
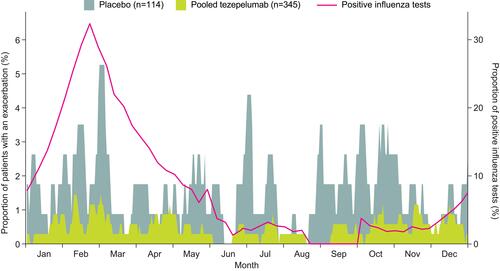
Figure 6 Relationship between asthma exacerbations and the influenza season in Eastern Europe.
Notes: The overlapping area plot shows the proportion of patients with asthma exacerbations per day throughout the year in a subset of patients from Eastern Europe. The purple line, associated with the secondary axis to the right, shows the mean proportion of positive influenza tests for Eastern Europe after aligning at the median peak for the period comprising the 2003–2004 to 2013–2014 seasons (excluding 2009–2010).Citation25