Figures & data
Table 1 Study Subjects
Figure 1 FACS analysis of blood ILC2 numbers. PBMCs from healthy control subjects (Control, n=12) and asthma subjects (Asthma, n=11) were analyzed by FACS. Panel (A) shows the gating strategy for ILC2s. Panels (B and C) show summaries of total numbers of PBMCs per milliliter of blood and proportion of conventional (CD127+CRTH2+) ILC2s in PBMCs. Panels (D and E) show total numbers of conventional (CD127+CRTH2+) and nonconventional (CD127+CRTH2−) ILC2s per milliliter of blood, respectively. Each dot represents 1 subject, and horizontal bars indicate the means. Male and female subjects are represented by open and closed symbols, respectively.
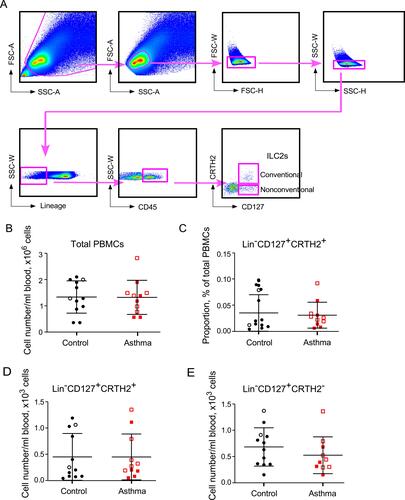
Figure 2 IL-33-induced cytokine production by PBMCs. PBMCs from healthy control subjects (Control) or mild asthma subjects (Asthma) were cultured with media alone, IL-33 alone (50 ng/mL), or IL-33 plus IL-2 (20 U/mL) (A, C, E). The levels of IL-5, IL-13, and IFN-γ in culture supernatants were determined by ELISA. Each dot represents 1 subject, and horizontal bars indicate the means. Alternatively, PBMCs were cultured with the indicated concentration of IL-33 with or without IL-2 (B, D, F). Data are presented as means±SEMs (n=8–12 in each group). *p < 0.05 between the groups indicated by horizontal lines.
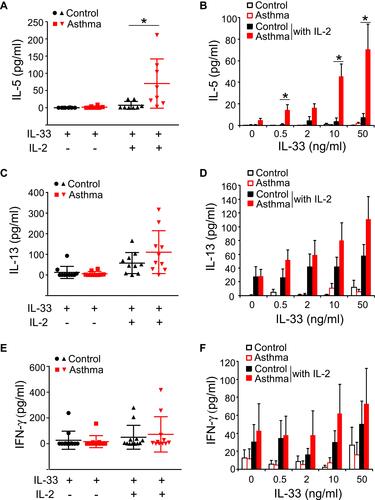
Figure 3 IL-25-induced-cytokine production by PBMCs. PBMCs from healthy control subjects (Control) or mild asthma subjects (Asthma) were cultured with media alone, IL-25 alone (50 ng/mL), or IL-25 plus IL-2 (20 U/mL) (A, C, E). The levels of IL-5, IL-13, and IFN-γ in culture supernatants were determined by ELISA. Each dot represents 1 subject, and horizontal bars indicate the means. Alternatively, PBMCs were cultured with the indicated concentration of IL-25 with or without IL-2 (B, D, F). Data are presented as means±SEMs (n=8–12 in each group). *p < 0.05 between the groups indicated by horizontal lines.
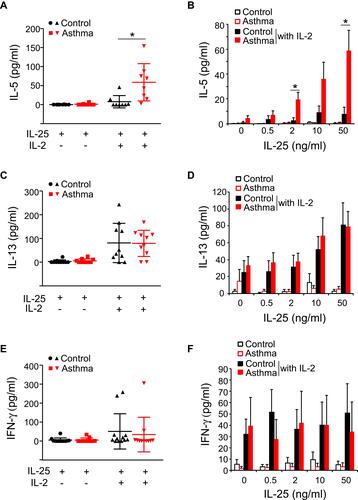
Figure 4 IL-12 effects on cytokine production by PBMCs. PBMCs from healthy control subjects (Control, n=4) or mild asthma subjects (Asthma, n=6) were cultured with IL-33 alone (50 ng/mL), IL-33 plus IL-2 (20 U/mL), or a combination of IL-33, IL-2 and IL-12 (5 ng/mL). The levels of IFN-γ (A) and IL-5 (B) in culture supernatants were determined by ELISA. Each dot represents 1 subject, and horizontal bars indicate the means.
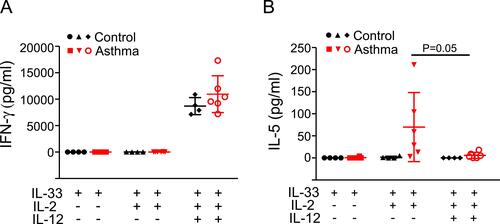
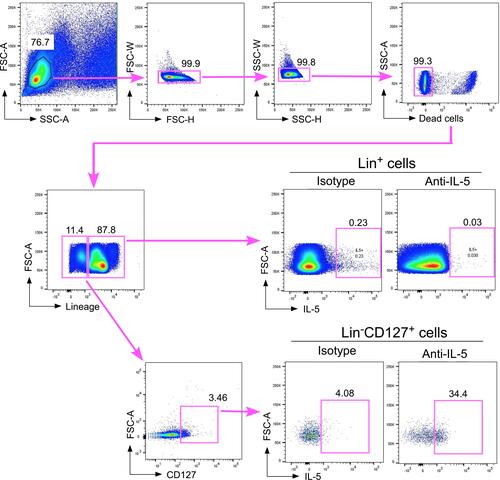
Figure 5 FACS analysis of IL-5 production by PBMCs. PBMCs from asthma subjects were cultured with IL-33 plus IL-2 for 4 days and with brefeldin A for the final 3 hours. The cells were then stained for intracellular IL-5 (or with isotype control antibody), lineage markers (CD3, CD11c, CD14, CD19, CD34, CD56, CD94, CD123, and FcεRIα) and CD127. IL-5 production was analyzed by gating on lineage-positive (Lin+) cells and the Lin−CD127+ cell population. Data are from one representative subject from three asthmatic subjects, which showed concordant findings.