
Figures & data
Table 1 Basic Characteristic of SAR Patients
Figure 1 Flow-chart of study design.
Abbreviations: RQLQ, Rhinoconjunctivitis Quality of Life Questionnaire; TNSS, Total Nasal Symptoms Score.
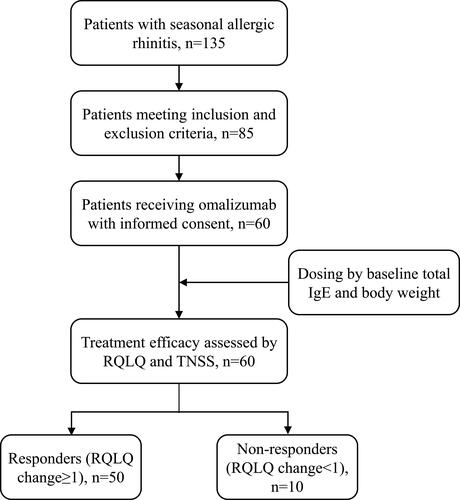
Table 2 Changes in RQLQ, TNSS, and ACT Scores from Pre- to Post-Treatment of Omalizumab
Table 3 Comparison of Baseline Characteristics and Treatment Efficacy Between Responders and Non-Responders to Omalizumab
Table 4 Multiple Linear Regression Analysis of Baseline Characteristics to Predict RQLQ Response to Omalizumab